As the search for new drilling opportunities in the Permian Basin continues, more operators are investigating lesser-developed formations and the basin’s outer edges. While the Spraberry and Wolfcamp intervals in the Midland Basin remain primary targets, operators are increasingly exploring deeper zones and fringe areas. Recent filings with the Texas Railroad Commission (RRC) indicate a rise in drilling and permitting activity in less-targeted formations like the Barnett Shale and Woodford formations.
In 2023, Pioneer Natural Resources began testing these formations, identifying thousands of potential drilling locations. Meanwhile, Elevation Resources focused its efforts on the Barnett Shale, refining its drilling techniques to improve the economic viability of this gas-prone formation. CEO Steve Pruett highlighted that although the Barnett produces more gas than the Wolfcamp, it has the advantage of lower water production, making the wells more cost-efficient.
Continental Resources also entered the scene, acquiring Midland Basin acreage to explore the Barnett Shale, joining the ranks of other operators like Diamondback, Occidental, Marathon, and SM Energy. These companies are exploring deeper targets in the Barnett as a complement to their existing operations in the Spraberry and Wolfcamp formations. SM Energy has reported promising results from two new wells targeting the Barnett and Woodford Shales, indicating the potential for significant development across 20,000 net acres of deeper oil reservoirs. At the same time, Vital Energy has also reported drilling four wells in the region, with flowback just beginning. The Midland Barnett is particularly attractive due to its higher oil cuts, averaging about 65%, compared to the Fort Worth Barnett, drawing increased interest from operators across the region.
Production History of the Barnett Shale
Approximately 20 years ago, the shale revolution began in the Fort Worth Basin, where the Barnett Shale became one of the largest onshore natural gas fields in the U.S. The Barnett Shale, often called the “grandfather” of U.S. shale plays, was the first formation where Mitchell Energy & Development unlocked shale gas using hydraulic fracturing. As the revolution moved west to the Permian Basin, efforts to fully unlock Barnett’s potential faced challenges. However, producers successfully adapted the technological advances in horizontal drilling and hydraulic fracturing from the Barnett to the Spraberry, Wolfcamp, and Bone Spring formations, driving the Permian’s production to a record 6.1 million barrels per day (bbl/d), according to TGS Well Data Analytics. As the top tier undeveloped acreage across the basin dwindles, operators are now revisiting the Barnett Shale, specifically in the Midland Basin, as a promising new target.
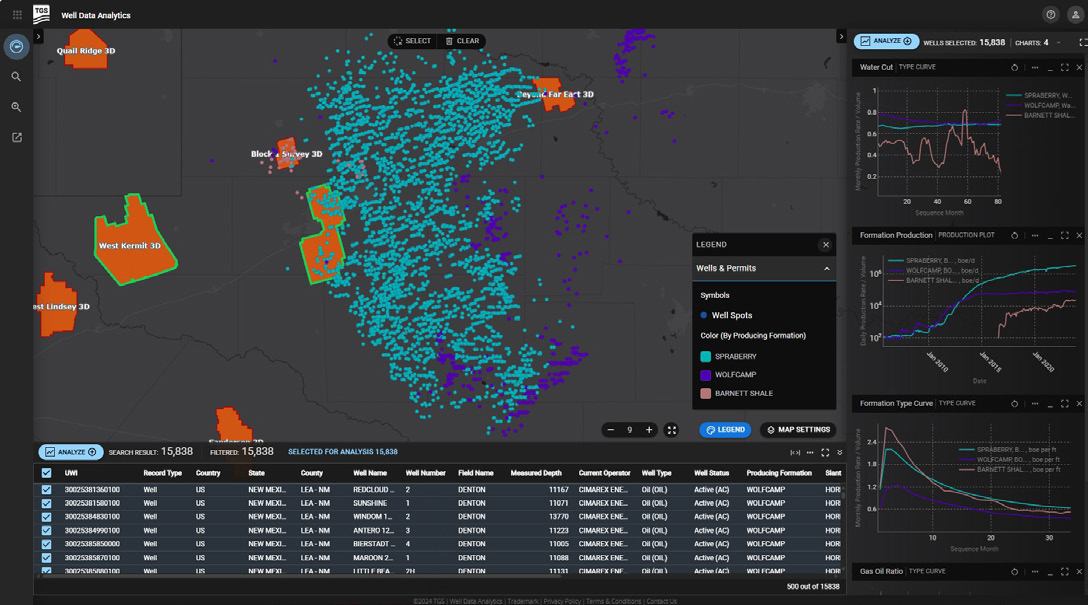
According to TGS Well Data Analytics, about 100 wells have been tested in the Midland Barnett since 2016, with production growing to nearly 25,000 barrels of oil equivalent per day (boe/d) by the end of 2023. As shown in Figure 1, on a barrels of oil equivalent per foot (boe/ft) of lateral length basis, Barnett wells reported a peak monthly rate of 2.9 boe/ft versus 2.2 boe/ft from Spraberry wells and 1.3 boe/ft from Wolfcamp wells. Over the life of production, the Barnett also exhibits a shallower decline rate and a higher EUR/ft, 10% higher than the Spraberry and 25% higher than the Wolfcamp. Although the Barnett produces a higher GOR, the water cut produced is much lower, averaging 44% compared to 64% and 74% for the Spraberry and Wolfcamp, respectively.
Geology of the Barnett Shale
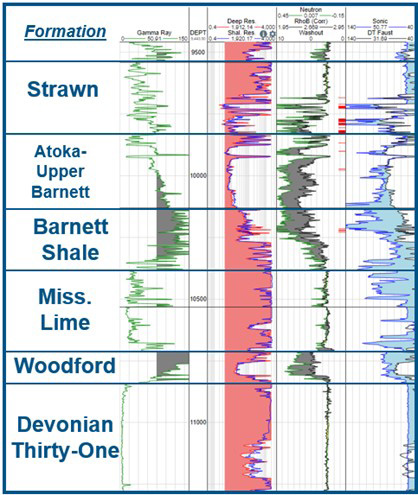
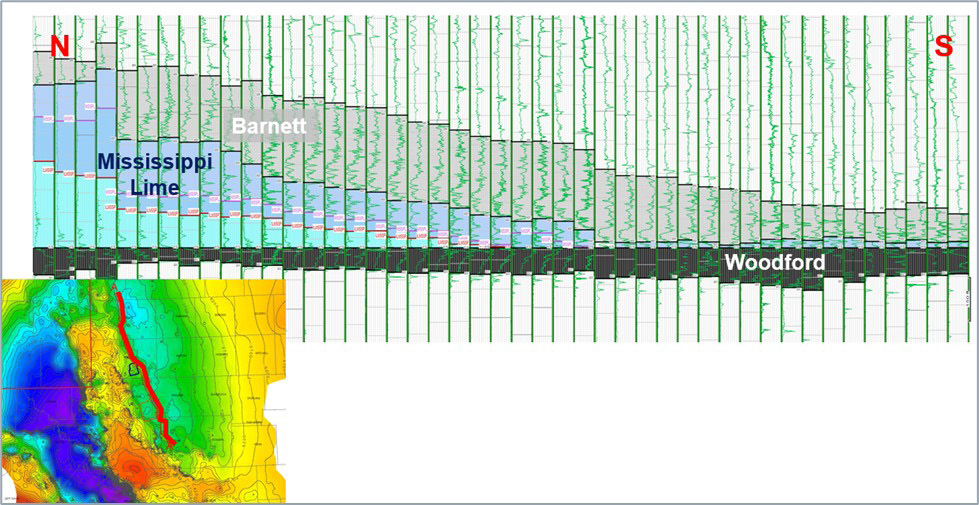
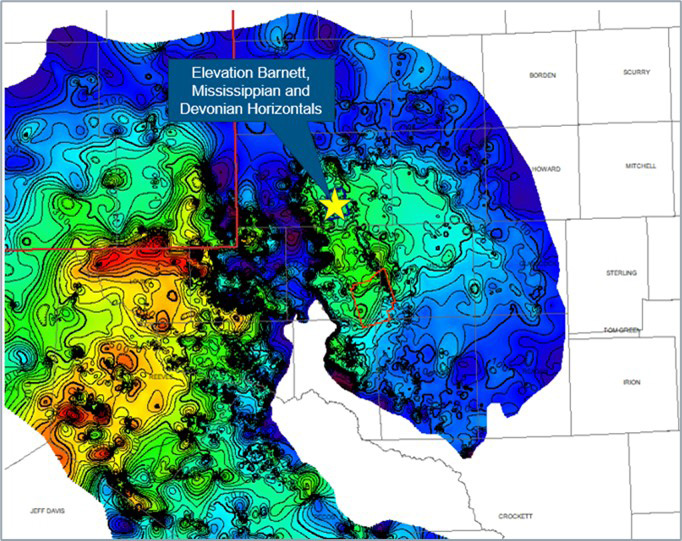
The Barnett Shale represents the Chesterian-Meramecian Mississippian transgressive sedimentary sequence in the Permian Basin as shown in Figure 2. TGS has interpreted over 60,000 wells across the Greater Permian Basin and has mapped nearly 7,000 Barnett penetrations. A north-to-south stratigraphic section of the Mississippian and Devonian strata, flattened on the Woodford Shale, highlights the stratigraphic architecture of the Barnett Shale and Mississippian Limestones Mapping reveals that the Barnett is broadly distributed across the Permian Basin as shown in Figure 4 and is thickest in the deeper cores of the Delaware and Midland Basins, while it has been eroded along the broader highs of the Central Basin Platform.
Recent exploration efforts and the identified play fairway are situated along the highly faulted and structurally complex Central Basin Platform/Midland Basin margin. This area represents
a convergence of favorable rock properties, thicknesses, depths, and temperatures. Current production mainly targets the lower Barnett, focusing on zones with higher resistivity, elevated gamma ray signatures, and lower clay volumes.
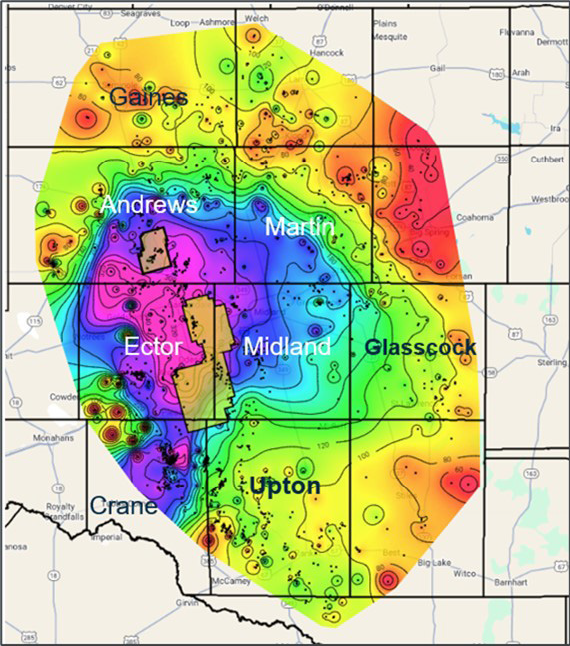
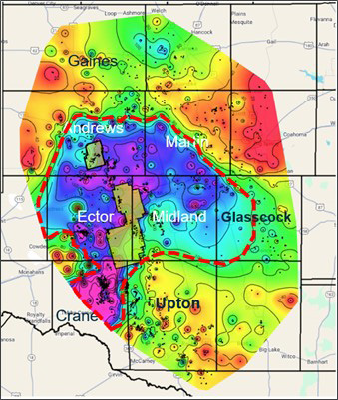
Petrophysical models and geologic mapping indicate that the most prospective areas for Barnett development are constrained to Ector, Andrews, Midland, Winkler, and Crane Counties. Analysis of over 1,100 wells penetrating the Barnett in the Midland Basin shows that the high gamma ray zone of the lower Barnett Shale reaches a maximum thickness of around 340 feet in the core of the Midland Basin, while the high resistivity pay zone is as thick as 200 feet in certain counties. These findings, based on porosity greater than 3% and resistivity of 175 ohms or higher, provide valuable insights into the Barnett’s potential for development (Figure 5 & Figure 6).
The Importance of 3D Seismic for Barnett Exploration
The Barnett Shale is located along the complex margin between the Central Basin Platform and Midland Basin. To accurately steer and land horizontal wells targeting the Barnett, a high-resolution understanding of the structural geology is essential, and 3D seismic data plays a critical role.
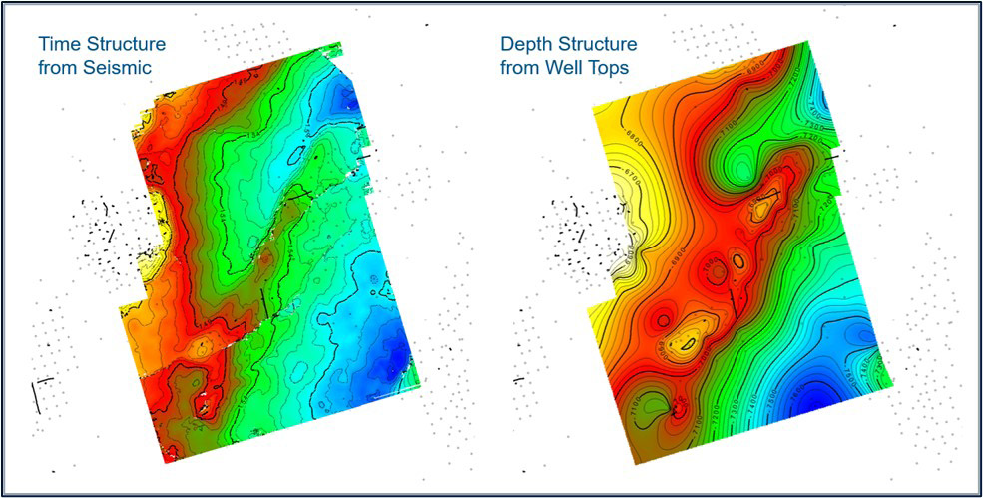
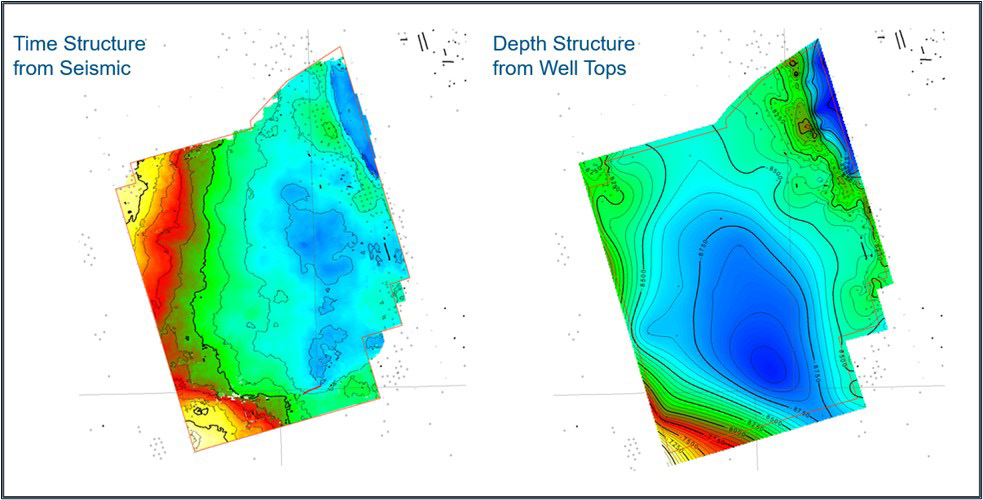
TGS completed the Block 1 3D seismic survey in 2019, covering 51 square miles in Andrews County. In early 2023, TGS also launched the Pontiac 3D seismic survey, spanning 167 square miles across Ector, Crane, Midland, and Upton Counties. Later that year, the survey was extended into Ector and Midland Counties, increasing its coverage to 267 square miles. These seismic surveys provide operators with enhanced visibility into deeper hydrocarbon accumulations in the Barnett, Mississippian, and Devonian formations. Insights from the Block 1 3D survey have already led to profitable Barnett wells, and future production growth is expected as more wells are drilled in these formations.
Wells targeting the deeper Mississippian-Ordovician section are sparsely spread across the basin, and boreholes are typically concentrated on the crests of producing structures. The application of 3D seismic data will significantly enhance both the structural and stratigraphic framework of the play. In areas where the Block 1 3D and Pontiac 3D seismic surveys have been conducted, structure maps derived from seismic data have provided a significant uplift in the accuracy of structural interpretations compared to well-only data (Figure 7 & Figure 8).
The Role of 3D Seismic in Well Performance
To measure the impact of the 3D seismic data on drilling programs, we evaluated the productivity of wells within the Block 1 and Ponti- ac 3D survey areas that began production in or after 2010. By utilizing historical and forecasted production data from TGS Well Data Analytics, along with TGS stratigraphic models (“TGS Landing Zone”), we were able to benchmark well performance and assess landing zone targets.
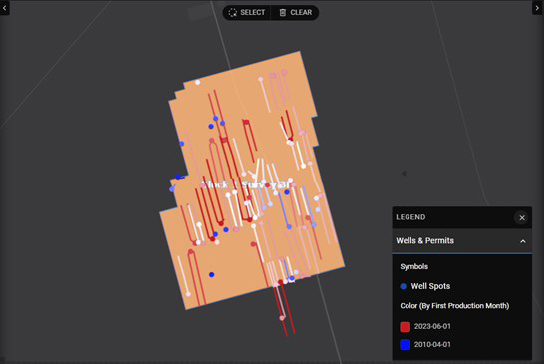
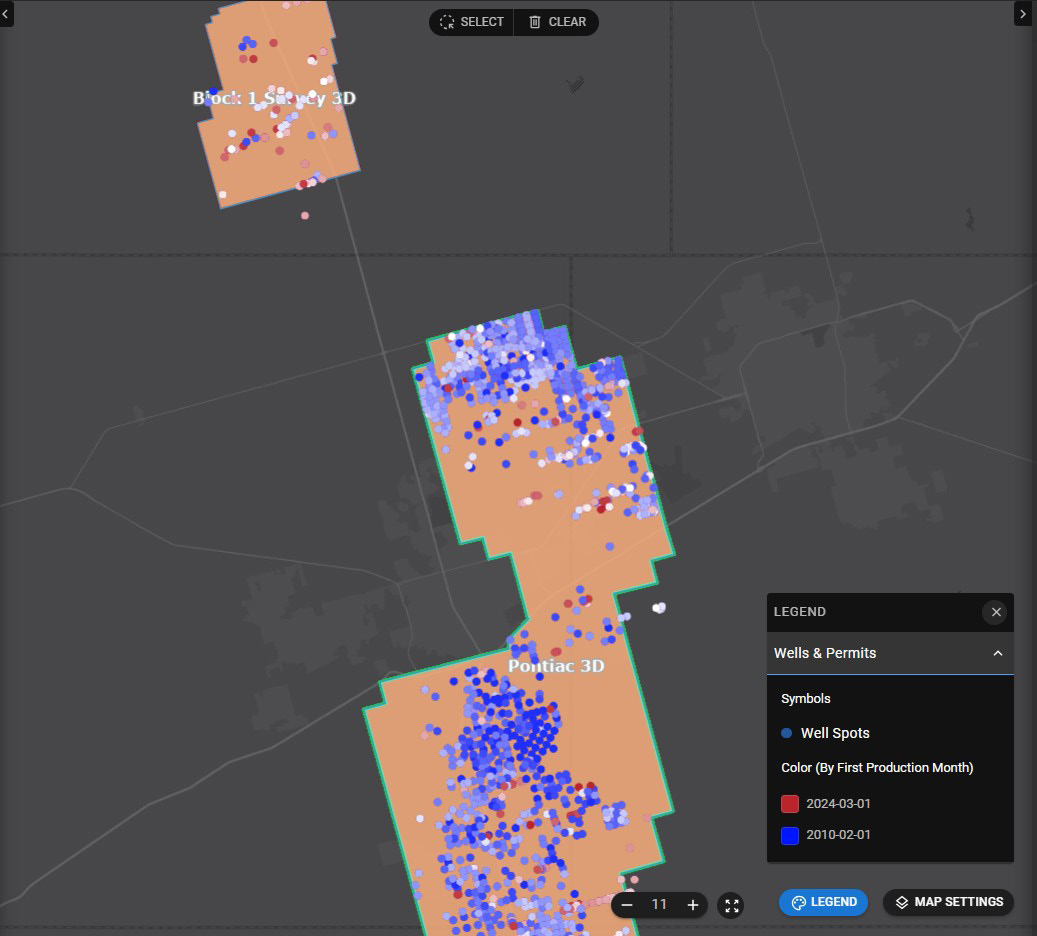
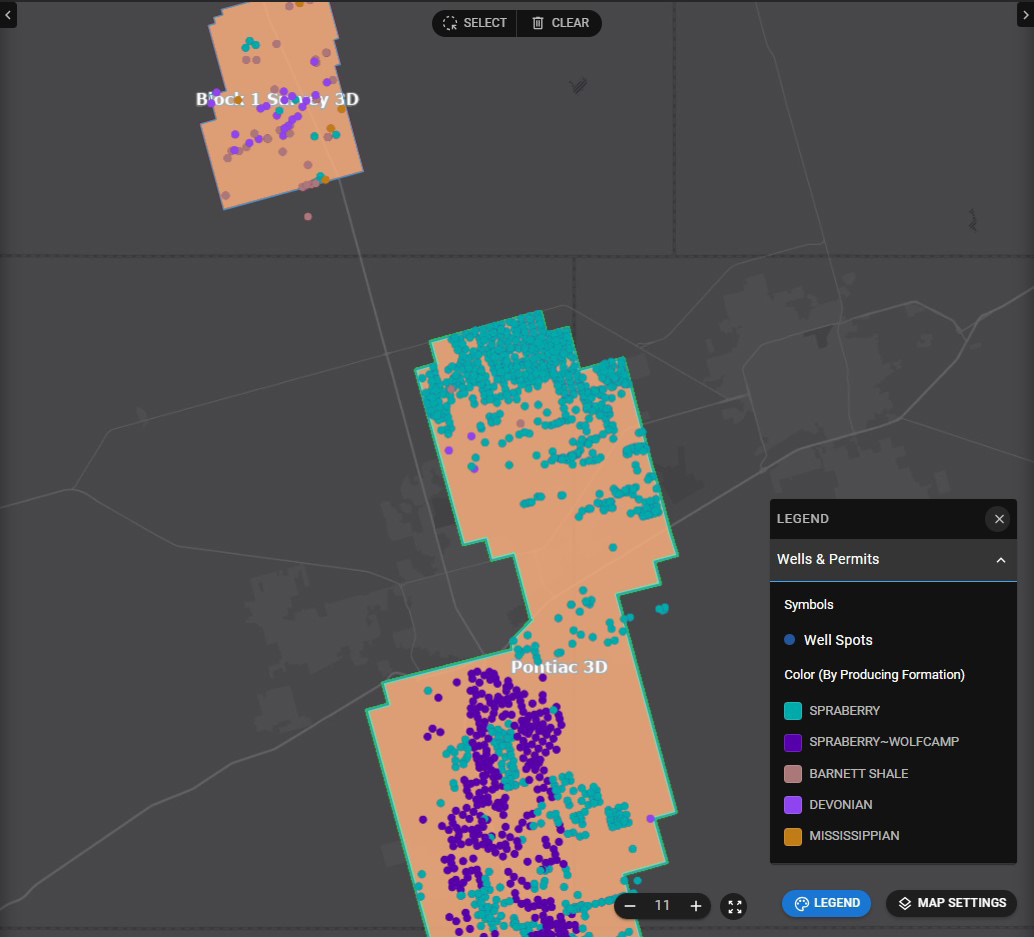
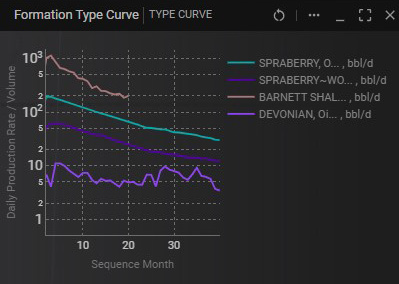
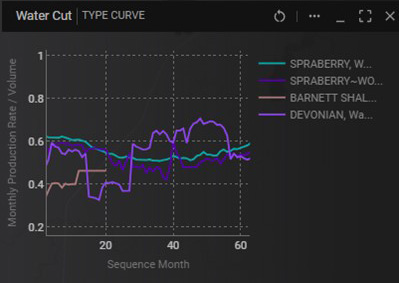
According to the analysis, most wells in the Block 1 3D survey area are new, drilled and completed after 2020, following the processing of the Block 1 survey, with a focus on the Barnett Shale (Figure 9). This indicates that operators are increasingly exploring deeper zones and fringe areas, using 3D seismic surveys to uncover new targets and enhance economic potential. Figure 10 shows the production type curves for these landing zones, demonstrating that Barnett Shale wells have significantly higher daily oil production and lower water cuts compared to shallower formations.
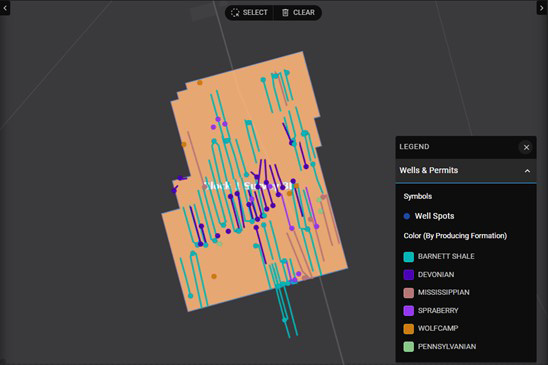
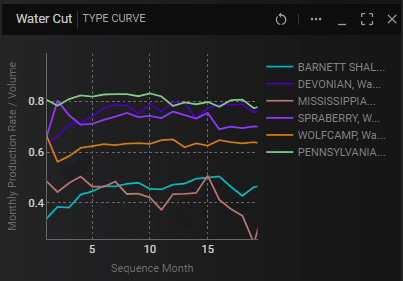
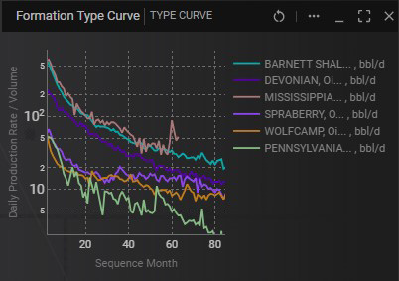
A similar analysis of the wells located within newest TGS 3D seismic survey, Pontiac 3D, reveals that most wells within this area are older and targeted the Spraberry and Wolfcamp formations, with only a few recent completions in the Barnett Shale (Figure 11). Figure 12 presents the production type curves for this area, grouped by landing zones. Despite the limited number of recent Barnett completions, these wells show significantly higher daily oil production and lower water cuts compared to wells in shallower formations. This suggests that operators can capitalize on the modern, high-resolution Pontiac 3D seismic survey to identify deeper, more economical formations like the Barnett, thereby boosting profitability.
Economic Viability and Seismic Insights
Using well economics data within TGS Well Data Analytics, we evaluated the performance of Spraberry and Barnett wells at current commodity prices. While Spraberry wells returned a positive NPV at $2.5 million and a 19% internal rate of return (IRR), Barnett wells face challenges due to high GORs, which cause them to flash negative NPVs at gas prices below $2.5/mcf. However, the lower water cut of Barnett wells results in lower variable costs, making them economically attractive under certain market conditions.
Conclusions
The main question we sought to answer in this analysis was: can we quantify the value of modern high-resolution 3D seismic by identifying changes in drilling programs due to seismic data? We analyzed landing zone selection in stacked plays and well economics and found that operators could develop additional landing zones. Wells drilled with the assistance of seismic data showed significantly better performance compared to those without. The additional NPV generated from identifying deeper, more economical formations like the Barnett, resulted in a strong return on investment. Another key takeaway is that this type of workflow can be efficiently conducted using TGS Well Data Analytics, enabling a broad range of benchmarking, optimization, and sensitivity analyses
