Introduction
The oil and gas industry is undergoing a significant transformation, driven by a surge in mergers and acquisitions that are reshaping the competitive landscape. These transactions reflect the sector’s adaptability to shifting market conditions and have the potential to influence the scale of U.S. hydrocarbon production, particularly from unconventional sources. As companies navigate this evolving environment, assessing the economic viability of assets remains critical, with factors such as commodity prices, operating costs, and regulatory policies playing a key role in shaping production trends.
This paper explores the primary economic drivers impacting short-term oil and gas production in major basins such as the Permian and Eagle Ford, with a particular focus on breakeven maps by county to highlight cost structures and development opportunities. It also introduces new Well Economics features within TGS Well Data Analytics (WDA), including well aggregation and cash flow plots, designed to enhance asset valuation and streamline investment decision-making. Additionally, the analysis examines basin-specific rig activity, spudded wells, production trends, and type curve profiles to further assess economic viability.
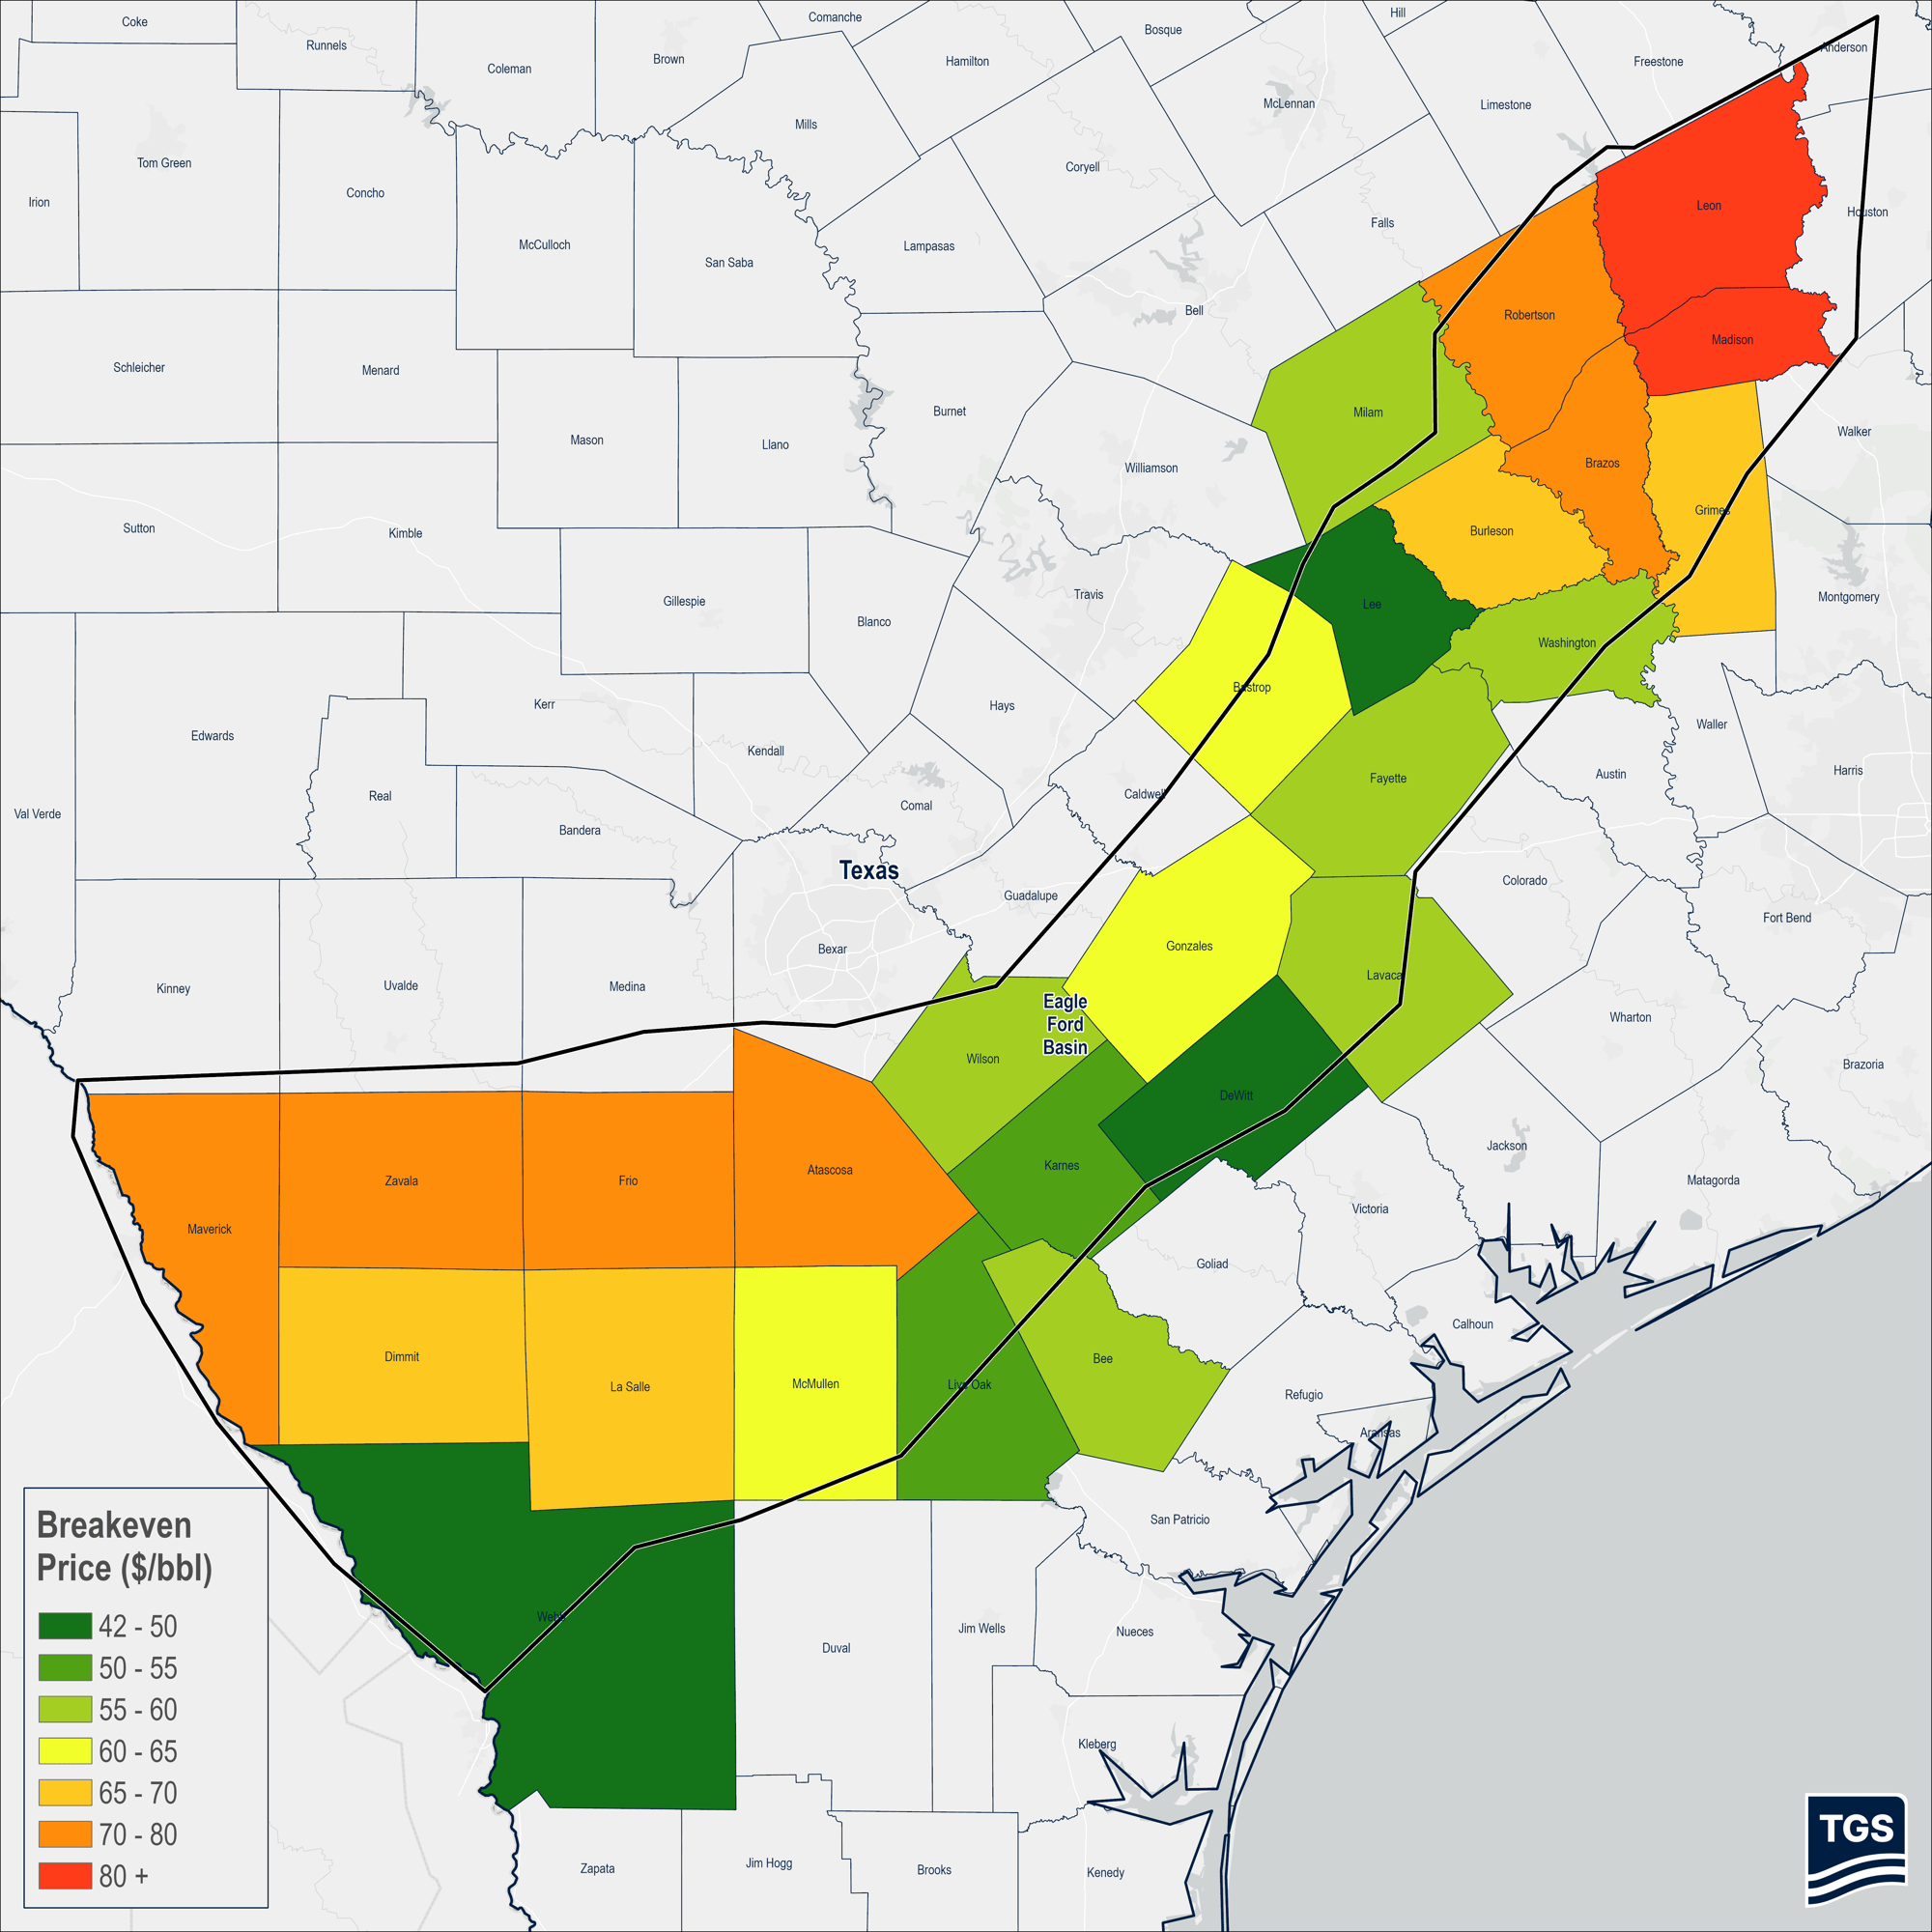
For instance, while the Permian Basin’s average breakeven price of $51.6 per barrel is lower than the Eagle Ford’s $59.8 per barrel, certain counties in the Eagle Ford – such as Webb, Dimmit, and Maverick – offer compelling development opportunities, particularly as market conditions grow more favorable for natural gas. A follow-up article will explore these opportunities in greater detail, focusing on the key gas basins: the Appalachia and Haynesville Basins.
Let’s start the analysis by understanding market conditions in the U.S. and how they could impact oil and gas development in the near future.
Short-Term Energy Outlook for North America's Oil and Gas Industry
As of early 2025, the U.S. economy demonstrates strong growth, supported by robust consumer spending, low unemployment, and rising productivity. GDP growth is projected to exceed expectations, with estimates of around 2.5% for the year. While the Federal Reserve is likely to hold interest rates steady, ongoing policy uncertainties surrounding tariffs and immigration present potential inflationary challenges, adding complexity to the macroeconomic landscape.
The oil and gas industry plays a pivotal role in this economic backdrop, driven by surging global liquefied natural gas (LNG) demand and increased domestic energy consumption. Key production hubs like the Permian Basin and Haynesville Shale are experiencing sustained activity, bolstered by growing exports and infrastructure investments, including LNG terminals. At the same time, regulatory shifts and heightened focus on carbon emission standards are pushing companies to prioritize operational efficiency and sustainability. These factors position North America as a critical player in meeting global energy needs while navigating the ongoing energy transition and internal political changes.
Following a record high of 13.2 million barrels per day (b/d) in 2024, U.S. crude oil production is projected to rise to 13.5 million b/d in 2025, according to the EIA. However, production growth is expected to slow to less than 1% in 2026, with output averaging 13.6 million b/d as operators scale back activity in response to price pressures. West Texas Intermediate (WTI) crude prices are forecasted to decline from an average of $70 per barrel in 2025 to $62 per barrel in 2026 (Figure 1). The Permian Basin is set to maintain its dominant position, contributing over 50% of total U.S. oil production by 2026, according to TGS. While the Permian is expected to see continued growth, declines in production from other regions will offset these gains.

Natural gas production in the U.S. is set to experience moderate growth as demand continues to rise, particularly driven by LNG exports. Henry Hub spot prices are forecasted to rebound from a historically low average of $2.20 per million British thermal units (MMBtu) in 2024, increasing to $3.10/MMBtu in 2025 and $4.00/MMBtu in 2026 (Figure 2). This upward trajectory reflects tightening market conditions as demand growth outpaces production, keeping inventories at or below their previous five-year averages for much of the forecast period. The expanding role of LNG exports and sustained domestic consumption are expected to drive continued investment in infrastructure and supply chain optimization within the natural gas sector.

Dallas Fed Energy Survey Overview and What It Could Mean for the U.S. Market
Setting the stage for what to expect in 2025, The Dallas Fed Energy Survey highlighted slight improvements in the oil and gas sector during Q4 2024. Business activity turned positive, and company outlooks showed cautious optimism, while uncertainty among firms decreased.
Oil production remained relatively flat, with minimal growth, while natural gas production continued declining, albeit slower. Costs were stable overall, with modest increases in lease operating expenses. Oilfield services firms experienced weaker conditions, though declines in equipment utilization and margins slowed significantly.
Employment in the sector saw little net hiring, while wages and benefits edged higher. Respondents projected WTI crude oil prices to average $71 per barrel by year-end 2025 and Henry Hub natural gas prices to reach $3.19 per MMBtu, reflecting measured optimism for the near future.
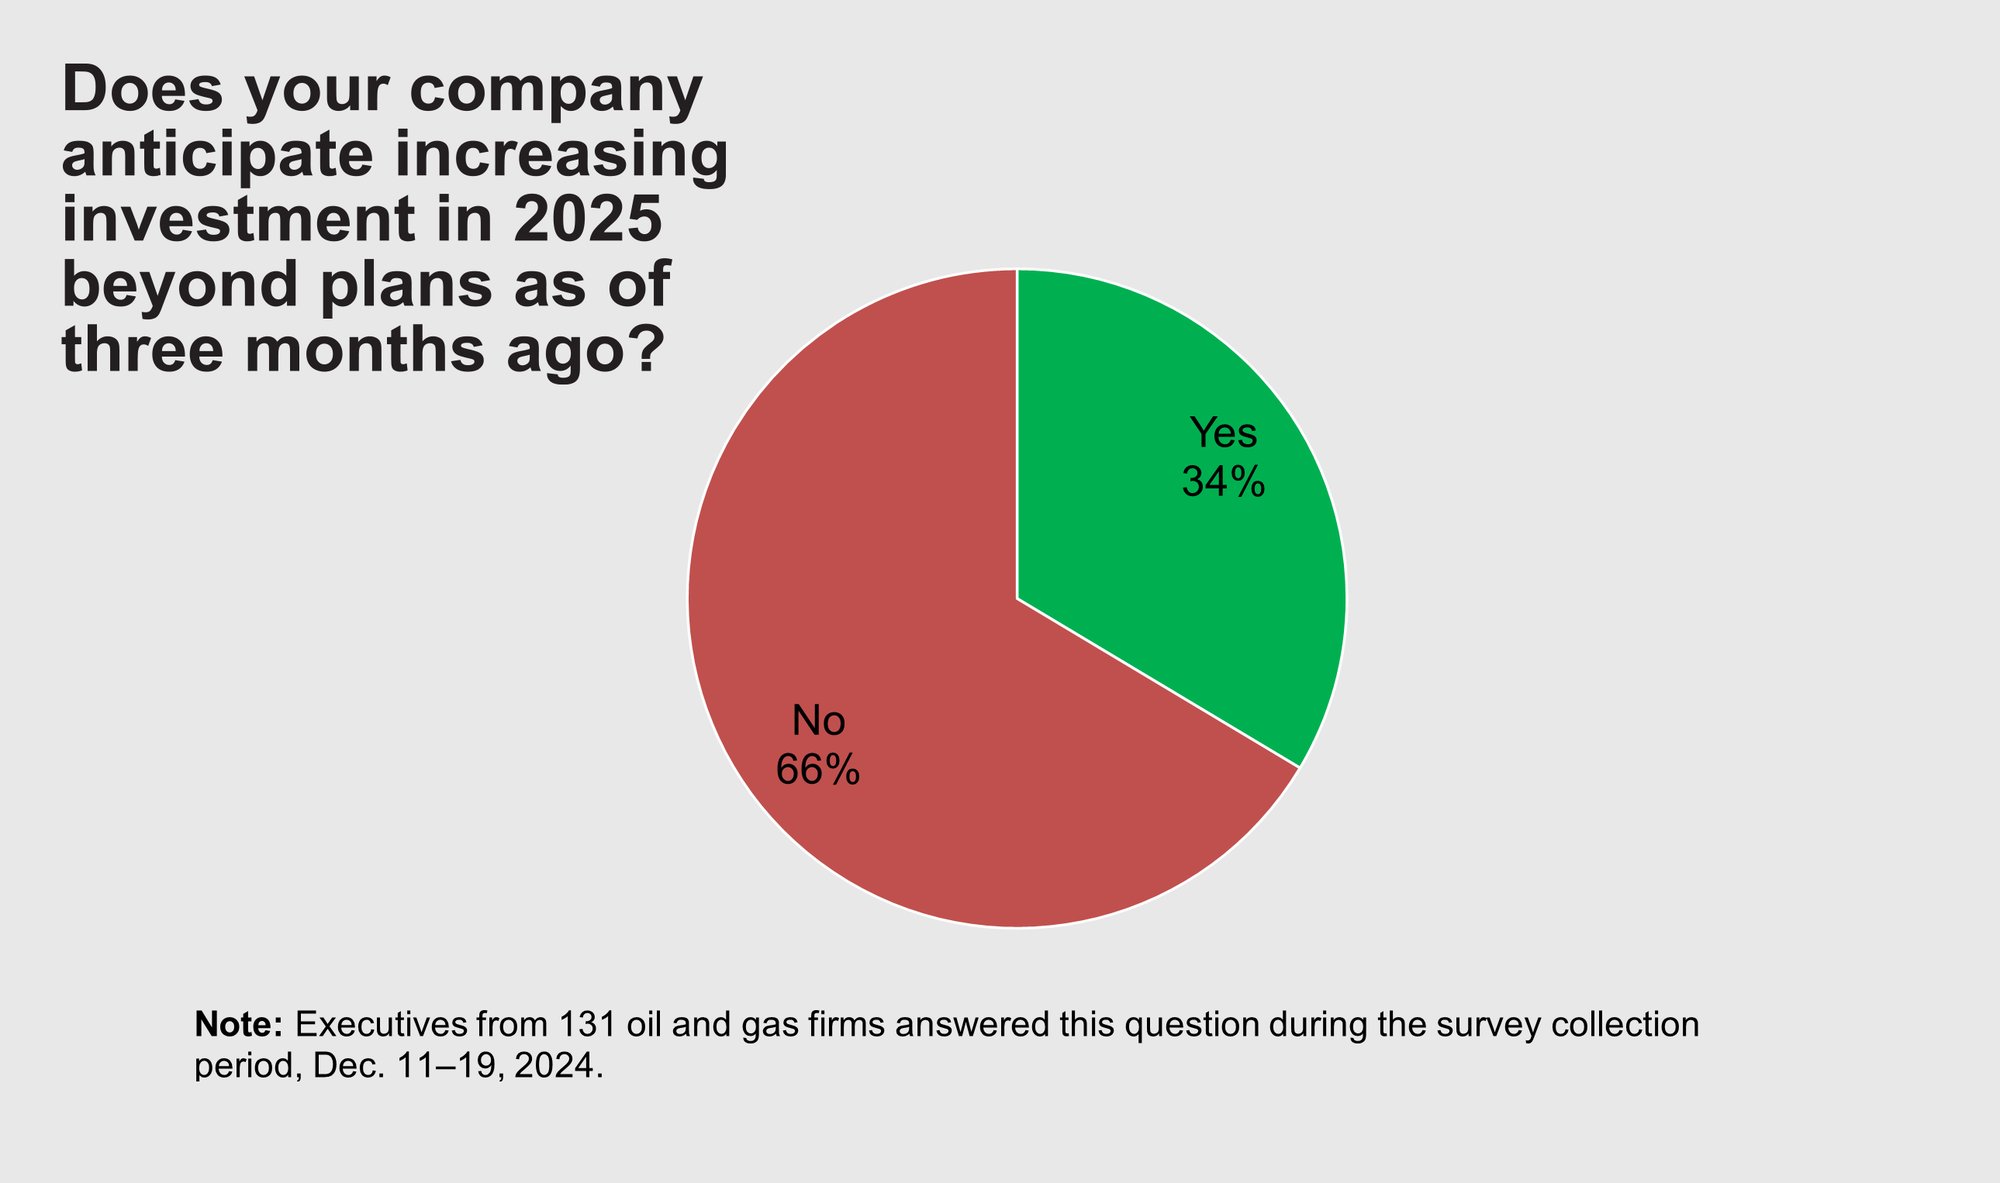
Regarding capital expenditure, most executives anticipate increased capital expenditure compared to 2024, with 43% expecting slight increases and 14% forecasting significant growth. However, 23% predict spending cuts, while 19% foresee similar levels to 2024. Trends vary by company size and type, with large exploration and production (E&P) firms more likely to anticipate reduced spending, while smaller E&P and support service firms leaning towards modest increases. Notably, 66% of executives have not revised investment plans recently, reflecting a cautious approach amid fluctuating market conditions and the incoming Trump administration (Figure 3).
Interestingly, despite the Trump administration's renewed "drill, baby, drill" initiative to boost domestic oil production, several factors may impede its success. The U.S. oil industry is exhibiting caution due to anticipated declines in global oil prices, with Brent crude projected to average $74 per barrel in 2025, leading companies to prioritize shareholder returns over increased drilling activities. Major firms like Chevron and ConocoPhillips have announced plans to reduce capital expenditures, focusing instead on technological advancements and efficiency improvements rather than expanding drilling operations. Additionally, the high costs and risks associated with new drilling projects, especially in challenging environments like Alaska and the Arctic, contribute to the industry's hesitancy. Companies are also mindful of potential policy reversals by future administrations, which could affect the long-term viability of such investments. Consequently, despite governmental encouragement, the oil sector remains cautious, emphasizing fiscal discipline and strategic planning over rapid expansion.
Rig Activity Analysis
After analyzing the key economic drivers, we shift our focus to the major unconventional basins, examining the critical factors influencing activity in each. The Permian and Eagle Ford serve as primary indicators for oil-based unconventional resources, while the Appalachia and Haynesville basins reflect trends in gas production.
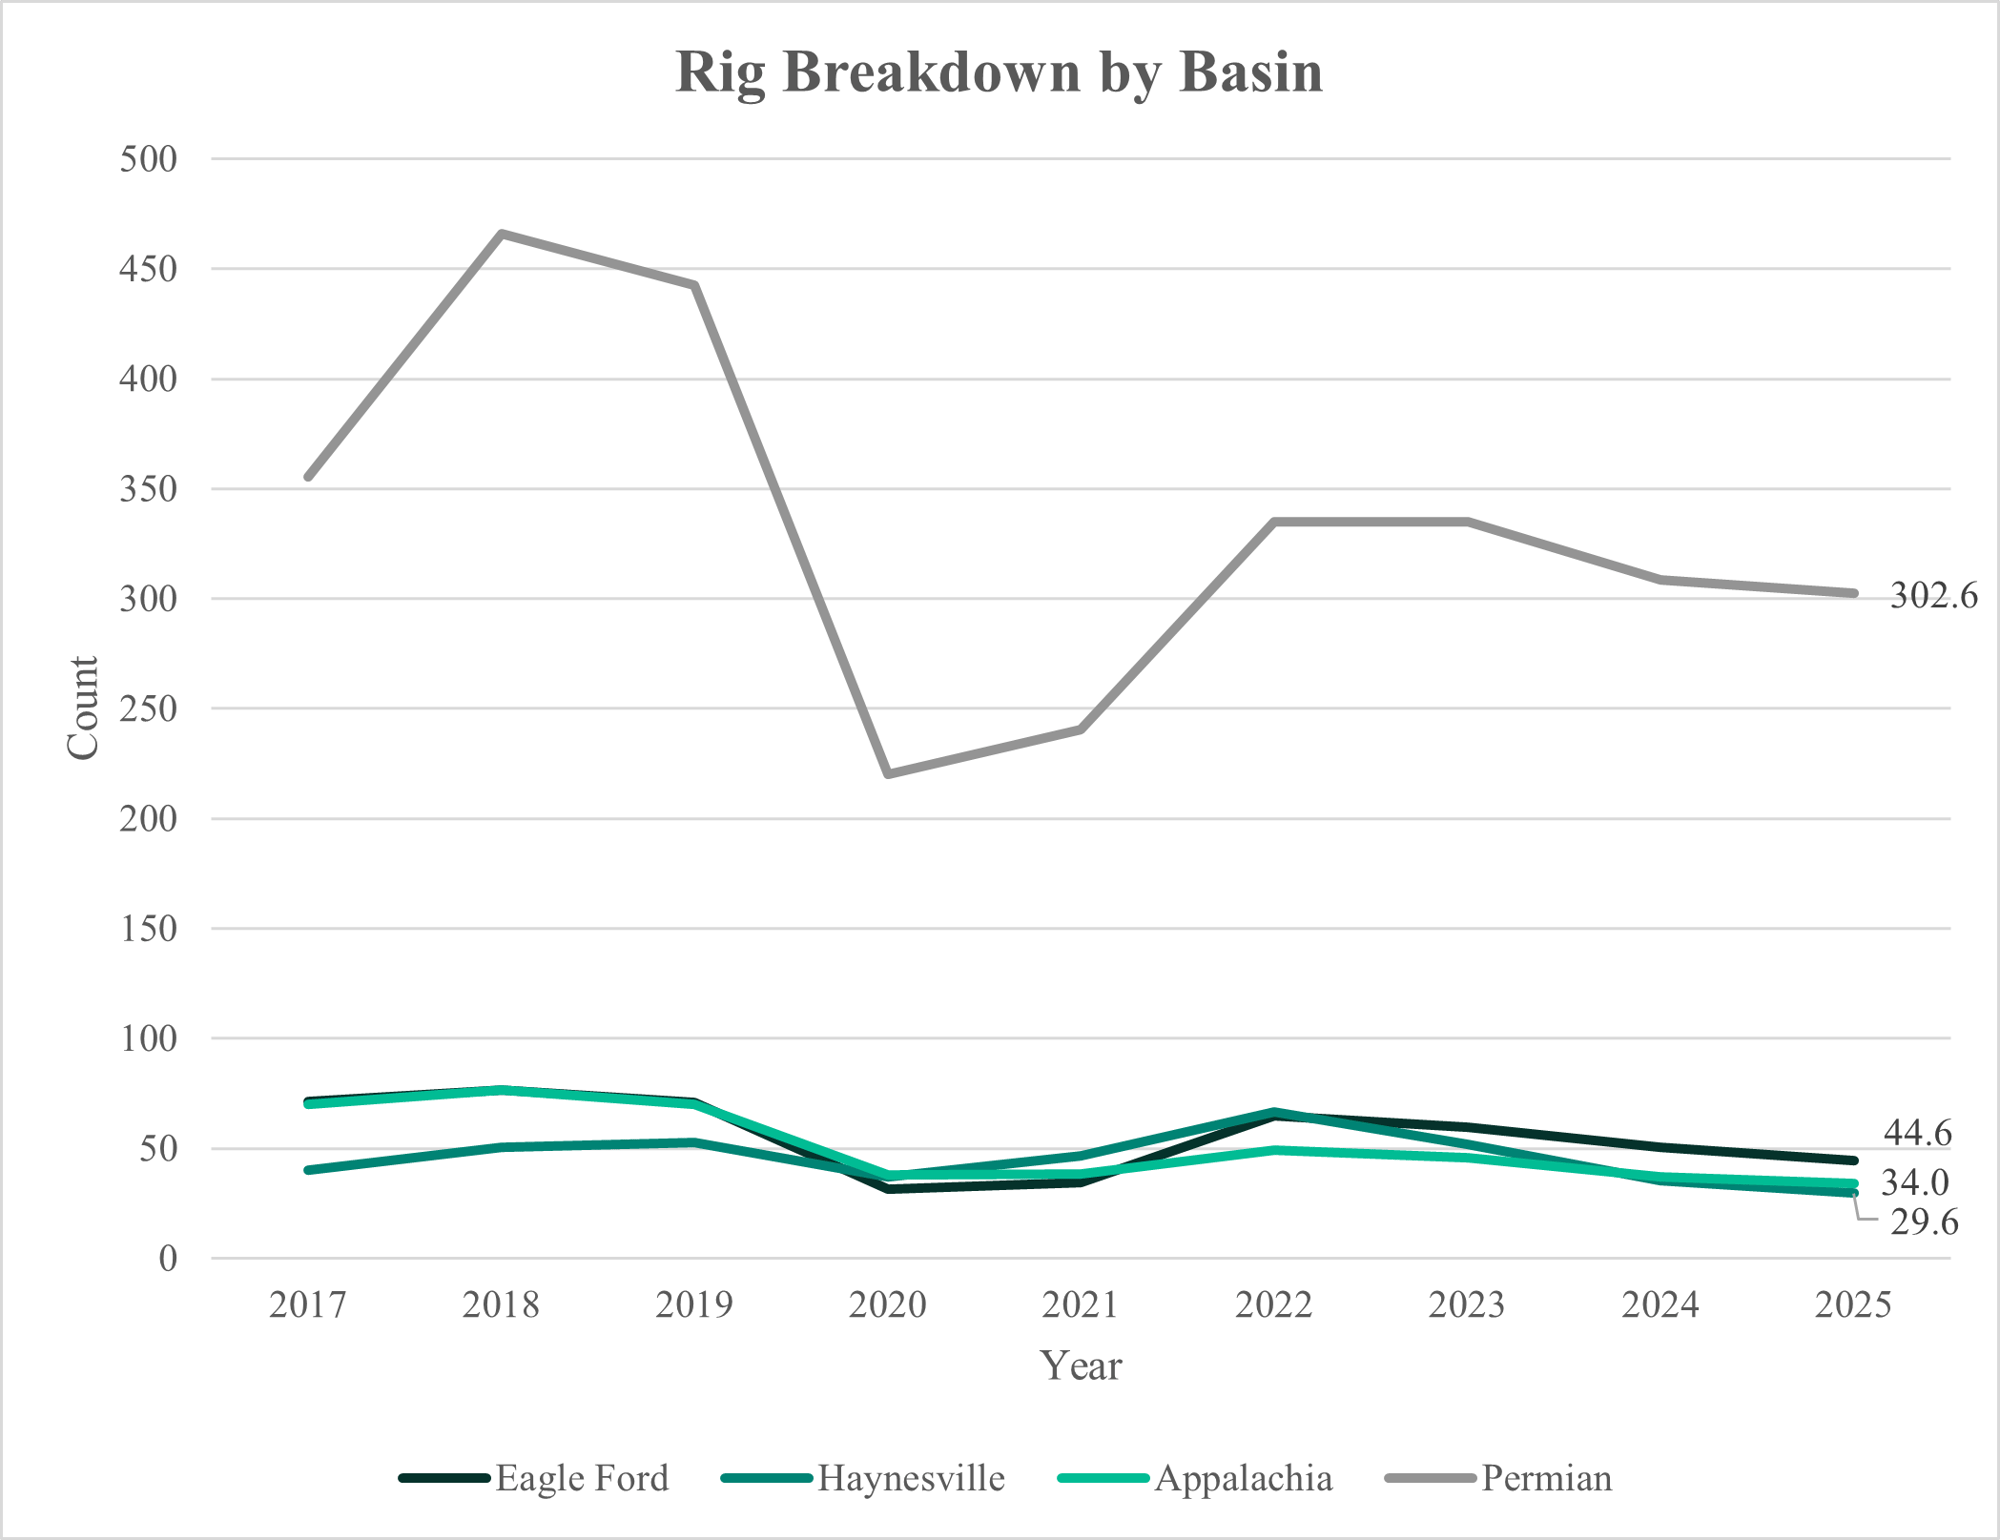
Rig trends across major U.S. basins show varying dynamics over the past decade. The Permian Basin consistently dominates in rig count, peaking at 466 rigs in 2018 before dropping significantly during the 2020 downturn, ultimately recovering to stabilize around 300 rigs by 2025. The Eagle Ford Basin mirrors a similar recovery pattern, with a notable decline in 2020, rebounding to 65 rigs in 2022 but tapering off to 45 rigs by 2025. The Haynesville and Marcellus basins have experienced more subdued activity. Haynesville saw a peak of 67 rigs in 2022 but declined sharply to 30 by 2025, while Marcellus has steadily decreased from its 2018 peak of 77 to 34 in 2025, reflecting a trend of reduced drilling activity in gas-focused regions. One important thing to note is that none of the basins have returned to pre-COVID activity levels (Figure 4).
1. Oil Basins Comparison: Permian and Eagle Ford
We now take a deeper dive into the key factors driving current and future activity in the major oil basins: the Eagle Ford and the Permian. A follow-up article will provide a similar in-depth analysis of the leading gas basins. WDA permit and drilling activity in the Permian and Eagle Ford basins reveal key differences in permit development and well efficiency. The Permian Basin has seen steady growth in permit development and well activity, though recent trends indicate some moderation. The Eagle Ford stands out for its high permit development efficiency, reflecting an optimized approach to converting permits into productive wells. Both the Delaware and Midland basins continue to be central to development efforts, with significant production from formations like the Wolfcamp and Spraberry. However, newer wells in these basins show signs of flattening productivity, suggesting the need for refined drilling and completion strategies to sustain long-term performance.
1.1 Activity Analysis
The Permian Basin demonstrates a consistent upward trend in permit development and well activity over time, peaking in 2022 with an 83% permit development rate. Despite a slight dip in activity by 2024 (where numbers are still finalizing), the basin's average permit development remains at a respectable 67%, with Delaware and Midland contributing nearly equally to total wells spudded (Figure 5). In contrast, the Eagle Ford Basin exhibits a remarkable permit development efficiency, averaging 101%. This efficiency peaked at 116% in 2019 and remained consistently high, highlighting a more optimized approach to converting permits into productive wells (Figure 6). As a result, permit activity in the Eagle Ford can be a reliable indicator for predicting future activity. However, in the Permian, a more cautious approach is necessary when using permit data to forecast future activity due to the noted gap between permits issued and actual development.
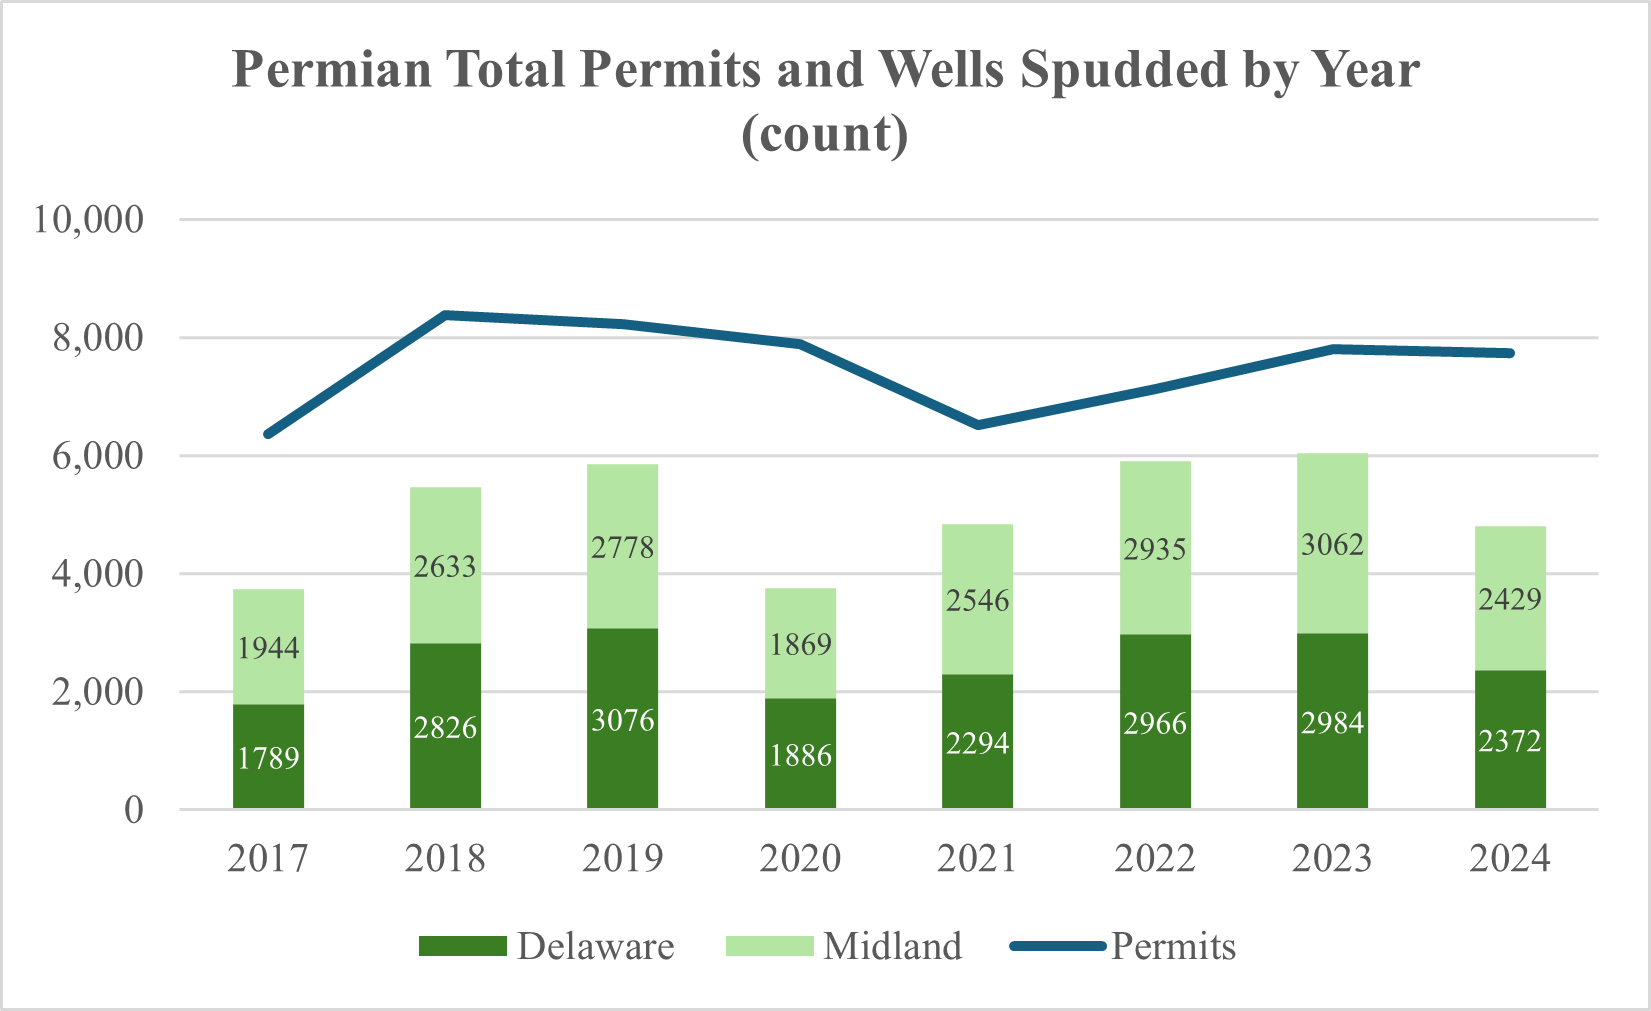
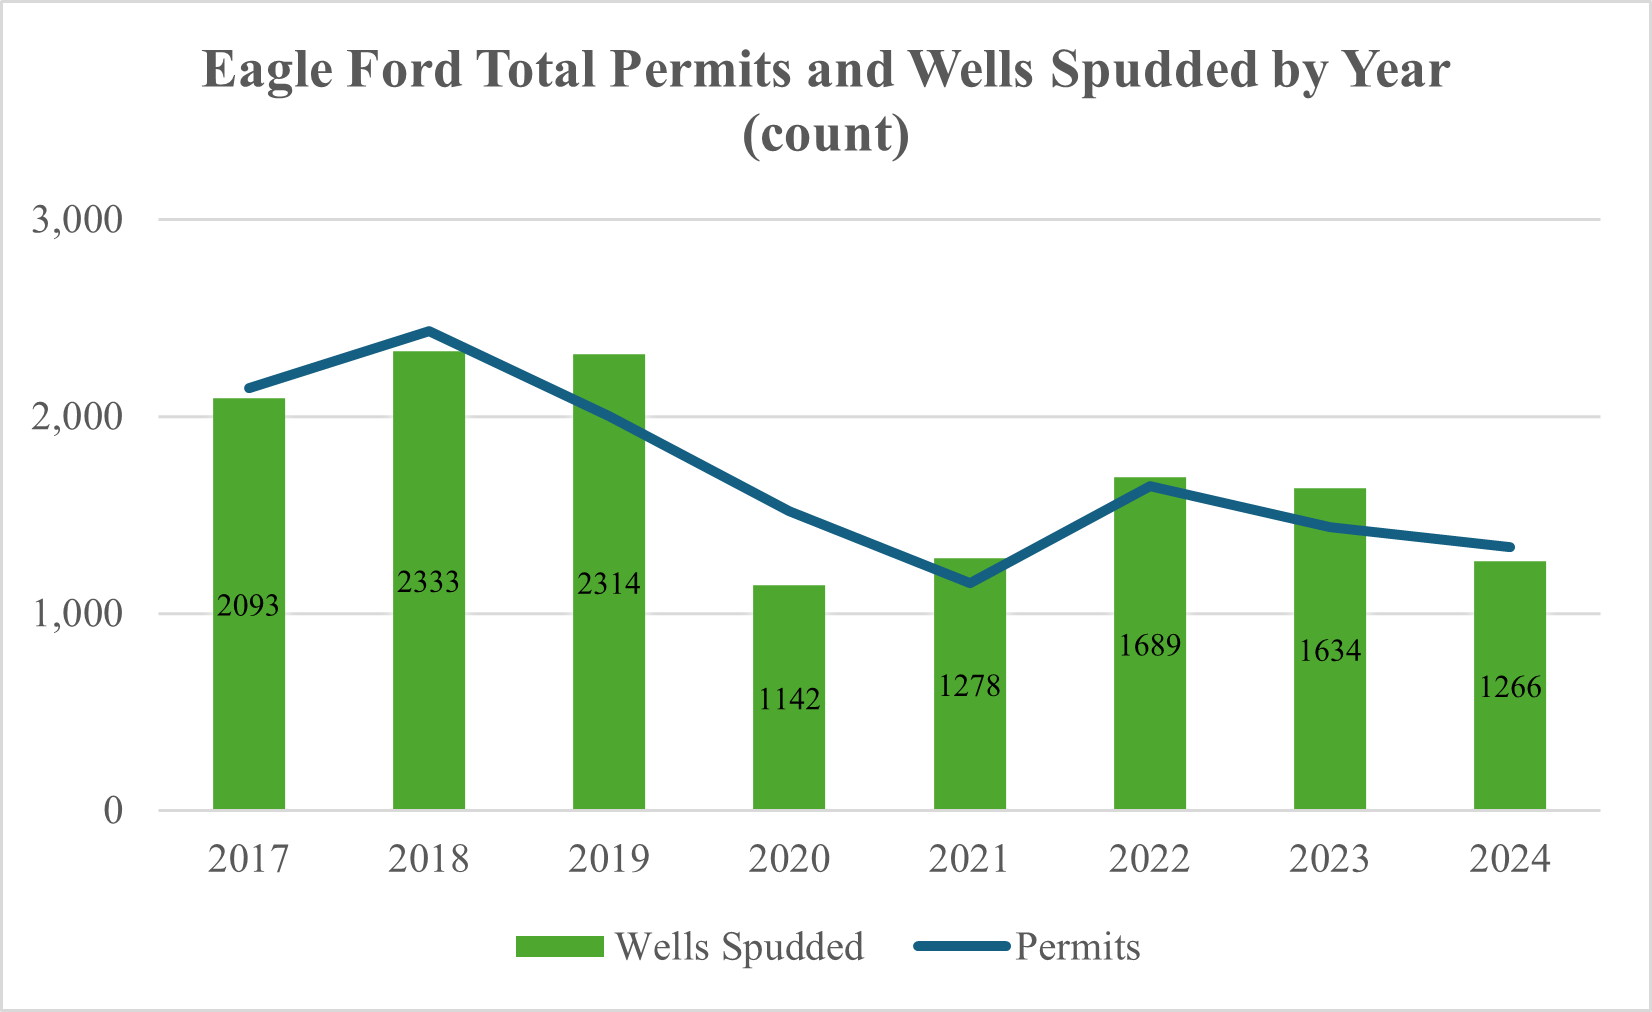
Figure 7 illustrates the number of wells spudded by county and vintage year in the Permian Basin. Midland and Martin counties show the highest well activity, steadily increasing over the years, peaking in recent vintages. Other counties such as Reeves, Howard, and Loving also exhibit significant drilling activity, though with some fluctuations across different years. The data suggests a strong and growing trend in well development in key counties, with newer vintages (2022-2024) maintaining high spudding counts, reflecting continued investment and exploration in the region.
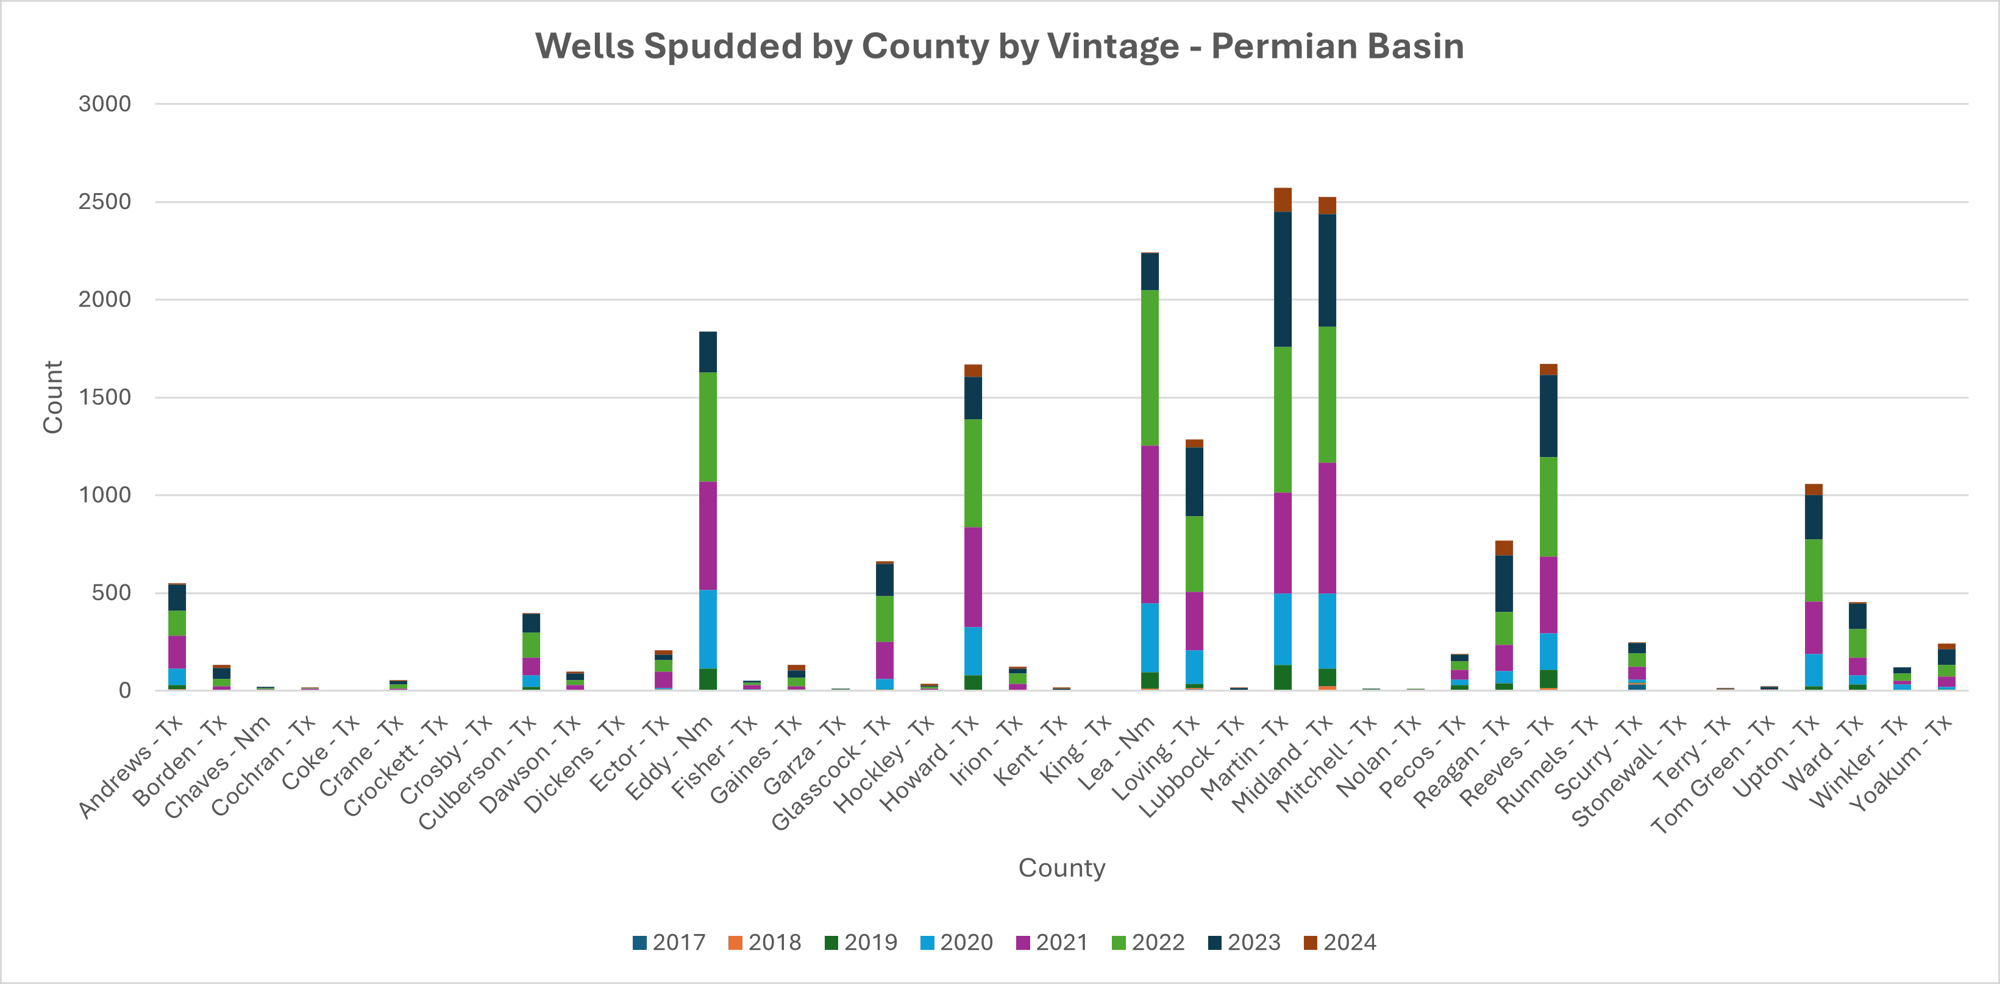
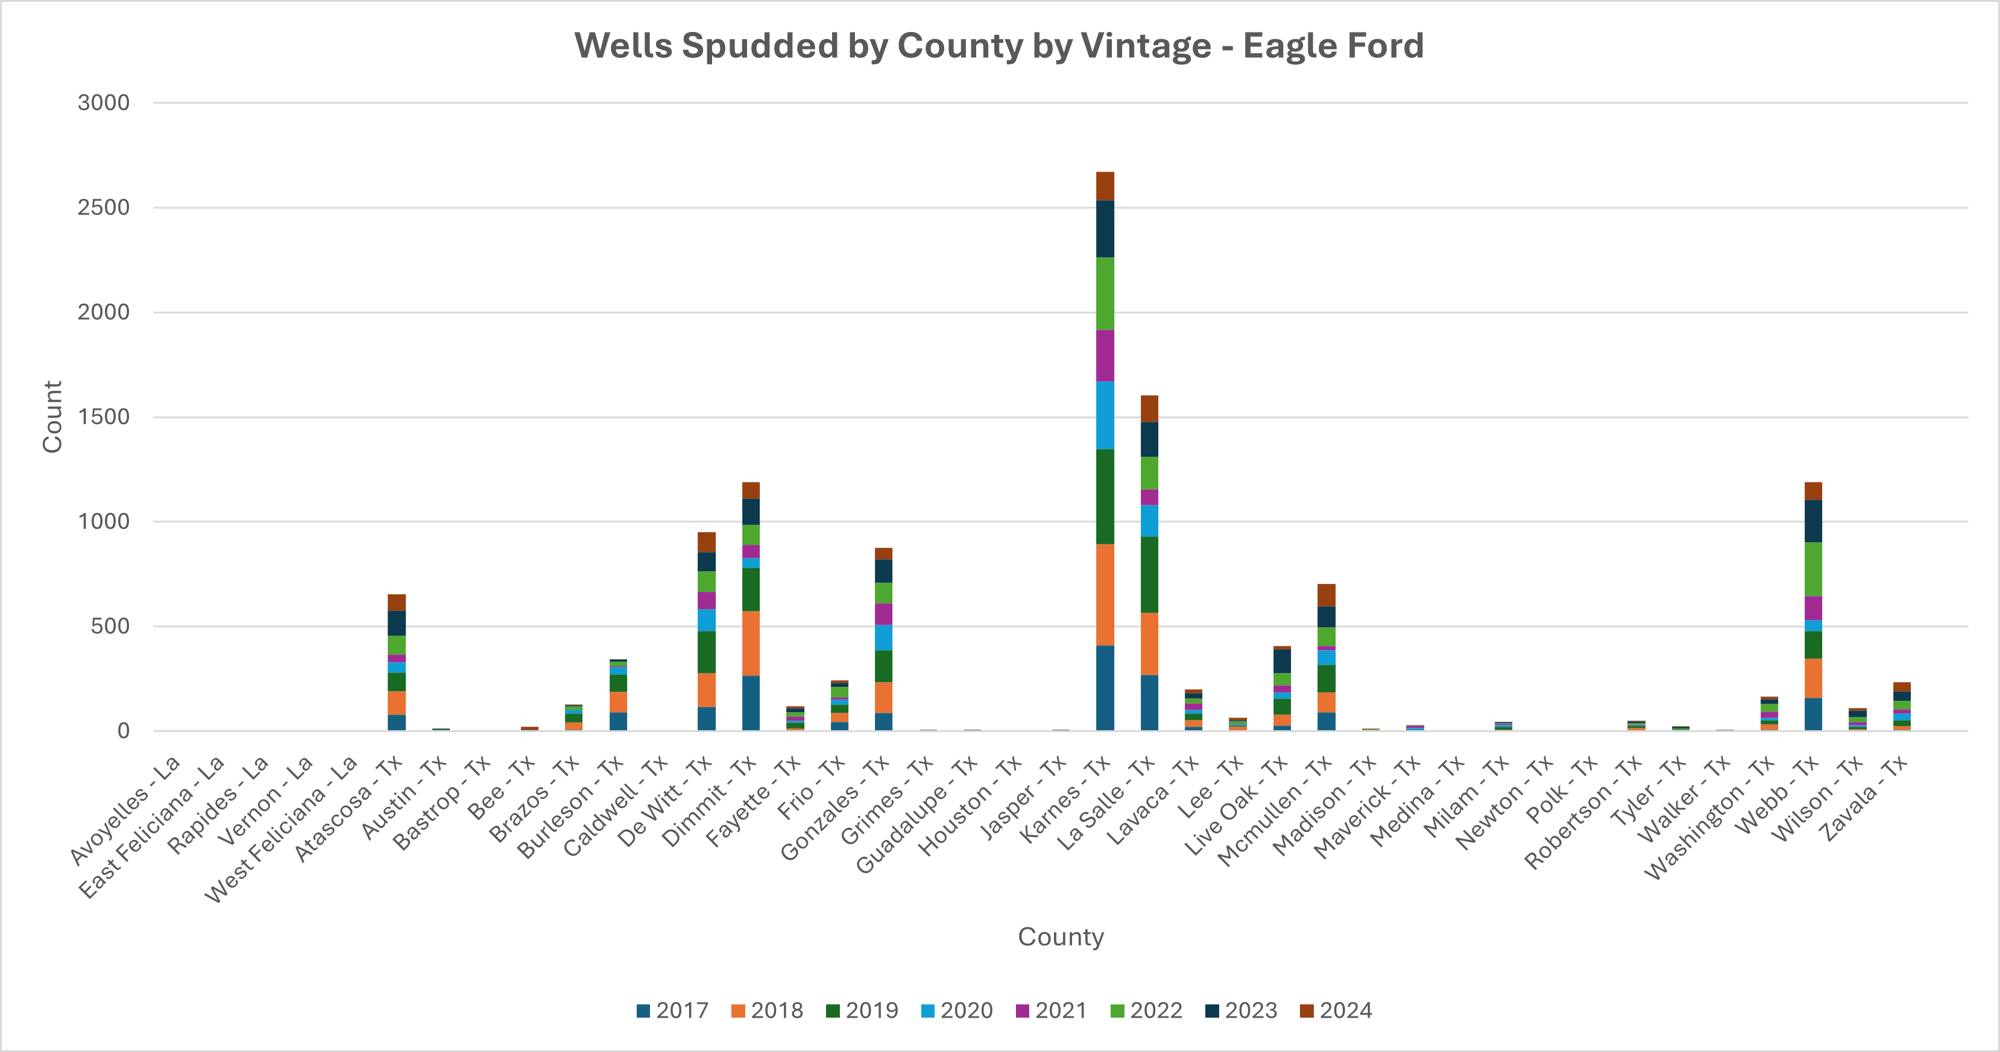
Figure 8, in the Eagle Ford Basin, highlights Karnes and La Salle counties with the highest well activity, with a steady decrease over the years, peaking in vintages 2018-2019. Other counties such as Webb, De Witt, Dimmit and Gonzalez also exhibit significant drilling activity, though with some fluctuations across various years. The data suggests a historically strong trend in well development in key counties; however, newer vintages (2022-2024) show a decline in spudding counts, indicating a potential slowdown in investment and exploration in the region.
1.2 Lateral Length Evolution
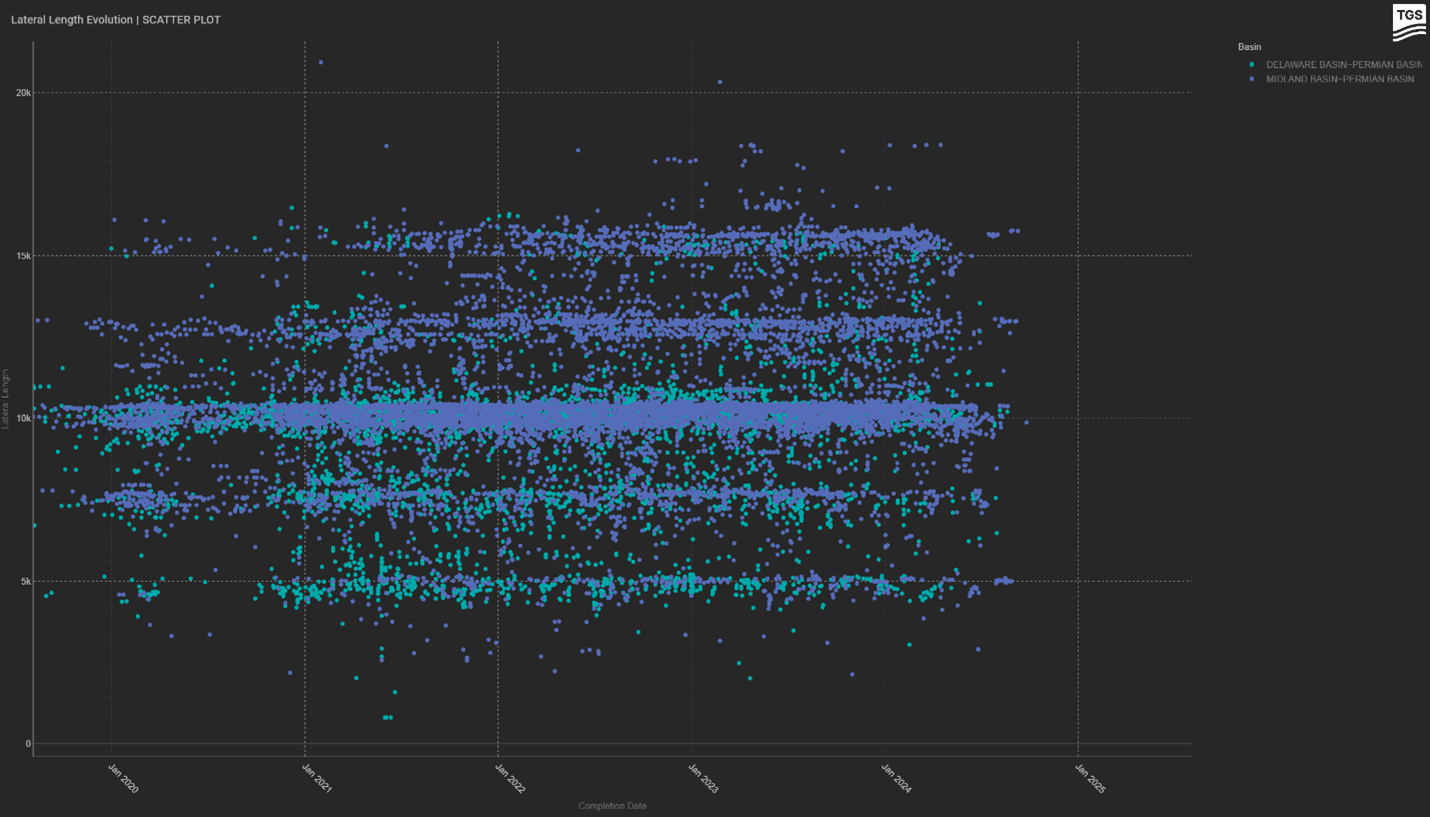
Using WDA, lateral length evolution was analyzed since it is an important factor to understand how the hydrocarbon resource gets to be developed. In 2024 TGS wrote a spotlight article stating the following findings: the nationwide average lateral length declined for the first time in over 15 years, dropping from 9,974 ft in 2023 to 9,821 ft. However, this trend varied by region—while the Permian’s Midland (-7.34%) and Delaware (-5.83%) basins, along with the Anadarko Basin (-9.13%), saw reductions, other basins like the Appalachian (+15.45%), Gulf Coast (+5.20%), and Powder River (+5.97%) continued to expand. Additionally, Horseshoe Laterals gained significant traction, with companies like Matador Resources, Crescent Energy, and Vital Energy leading their broader adoption. This shift highlights evolving drilling strategies amid changing basin dynamics.
The scatter plot below illustrates all wells drilled in the Delaware and Midland basins since 2020, revealing a clear concentration around 10,000 ft lateral length (Image 1). The density of data points indicates that the Midland Basin is more mature, with a higher annual well count compared to the Delaware Basin. However, operators continue to extend lateral lengths, with some wells reaching 15,000 ft, 17,500 ft, and even 20,000 ft, reflecting a push for greater efficiency and resource recovery, particularly in the Midland Basin.
1.3 Production Analysis
The next phase of the analysis delves into identifying the sources of production, distinguishing between established mainstream production and emerging contributions from new intervals. This exploration aims to uncover shifting trends, assess the impact of new developments, and provide a clearer picture of the evolving production landscape.
Delaware Basin
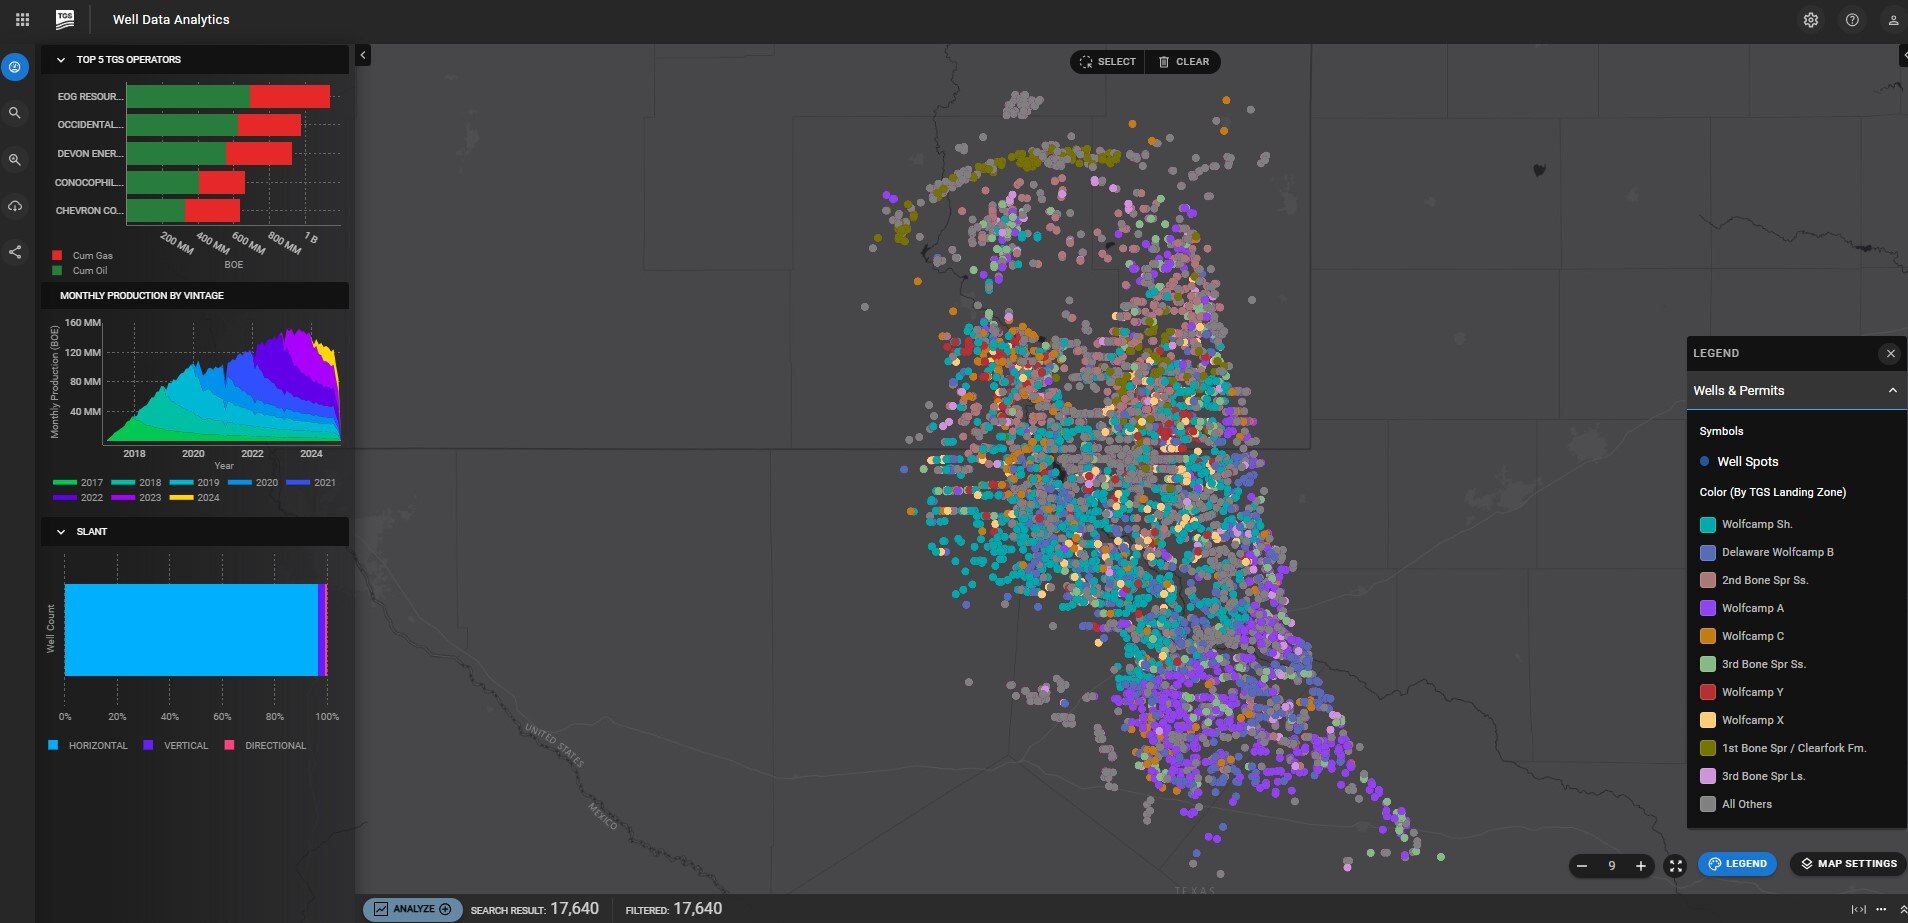
The Delaware Basin continues to be a focal point for oil and gas development, with production trends and well distribution highlighting its evolving landscape. The data visualization from WDA (Image 2) indicates that major operators such as EOG Resources, Occidental, and Devon Energy dominate drilling activity, with a significant concentration of wells in key producing formations like Wolfcamp and Bone Spring. Monthly production by vintage shows a steady increase in output over time, reflecting continued investment and advancements in completion techniques. However, newer vintages exhibit a flattening trend, suggesting potential declines in well productivity or shifting reservoir dynamics.
The spatial distribution of well spots reinforces the extensive development across the basin, with clusters of high activity aligning with historically prolific zones, like Lea and Loving counties (Figures 7 & 11).
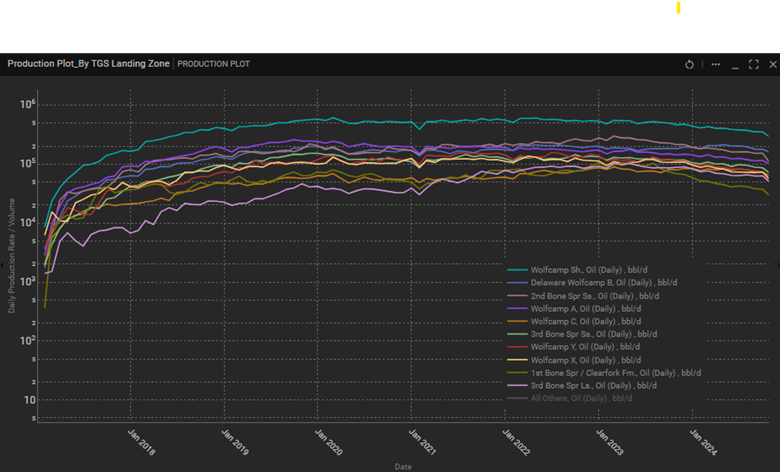
The production plot further illustrates the performance trends of different formations, with Wolfcamp and Bone Spring standing out as the dominant contributors. Wolfcamp wells consistently demonstrate higher initial production rates and sustained output over time, while Bone Spring formations show more variability but remain competitive (Image 3). The Wolfcamp Shale (Wolfcamp A) leads production with approximately 249,000 barrels per day, followed by the Delaware Wolfcamp B at 178,000 bbl/day. The 2nd Bone Spring contributes a significant 152,000 bbl/day, while Wolfcamp A produces around 117,000 bbl/day. Meanwhile, the 3rd Bone Spring adds 92,000 bbl/day, highlighting the key intervals driving output in the region.
Midland Basin
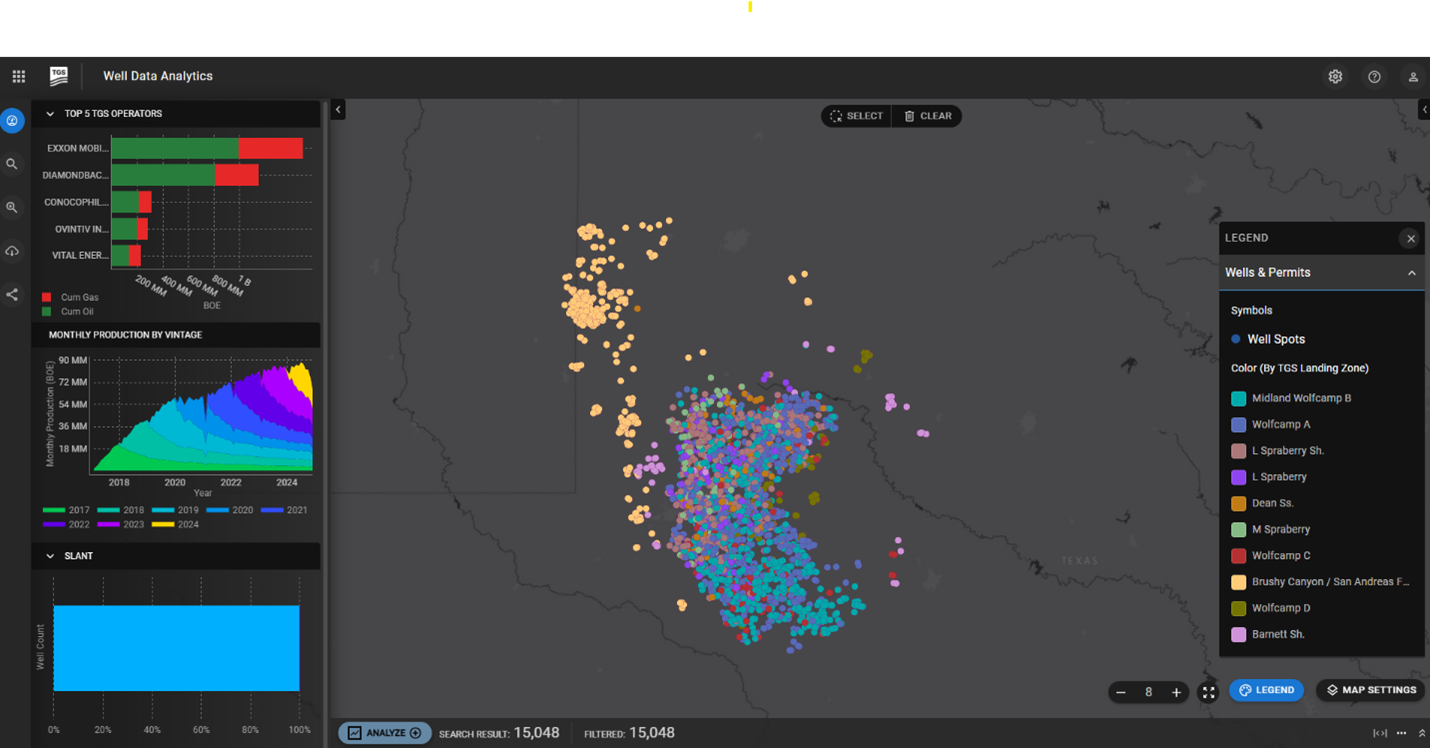
In the Midland Basin, data visualizations reveal that major operators such as ExxonMobil, ConocoPhillips, and Occidental are driving drilling efforts, with a strong presence in prolific formations like Spraberry and Wolfcamp. Monthly production by vintage reflects a steady increase in output, supported by ongoing investment and technological advancements. However, recent vintages indicate a potential plateau, hinting at evolving reservoir behavior or shifting completion strategies. The spatial distribution of wells highlights concentrated development in historically productive areas, like Midland and Martin counties (Figure 7).
The production plot further showcases formation-level performance, with Spraberry and Wolfcamp emerging as dominant contributors. Spraberry wells display consistently high production rates over time, while Wolfcamp formations exhibit strong early-time output with varying long-term trends. As newer wells show flattening productivity, operators may need to refine drilling and completion techniques to maintain efficiency and maximize returns in this highly competitive basin.
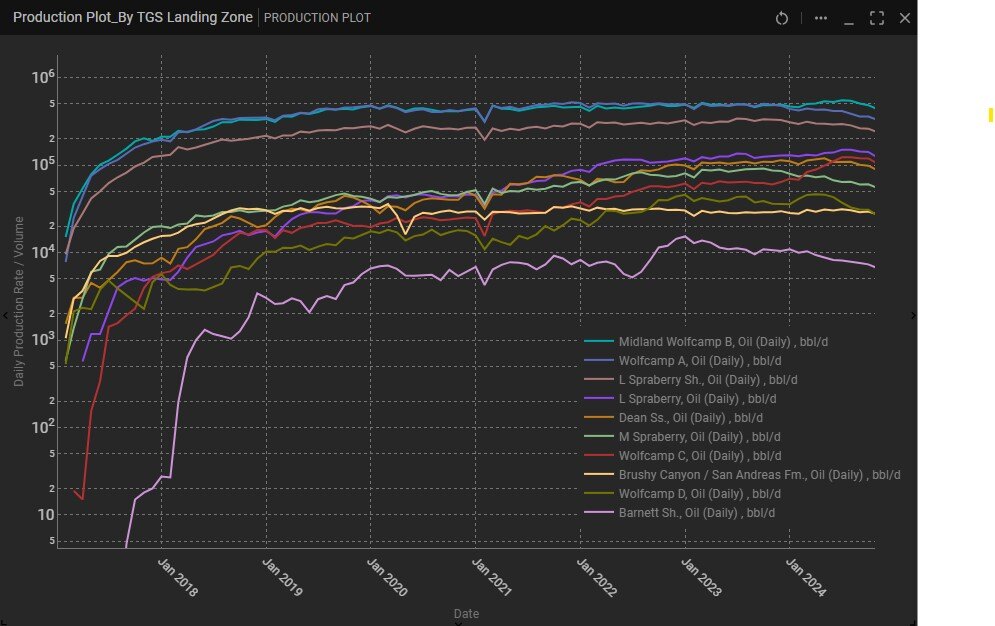
This trend is further reflected in production data, which underscores the dominance of the Wolfcamp and Spraberry formations in the Midland Basin. Wolfcamp B leads output with approximately 490,000 barrels per day, followed by Wolfcamp A at 305,000 bbl/day. The Lower Spraberry Shale contributes a significant 269,000 bbl/day, while the Lower Spraberry formation itself adds 157,000 bbl/day. In contrast, all other formations, including the Barnett Shale, account for a much smaller share, producing around 6,300 bbl/day. However, despite its relatively low current production, the Barnett Shale is gaining attention as an increasingly attractive drilling target (Image 5).
In recent years, the Barnett Shale (light orange dots in Image 4) has emerged as an important focus within the Midland Basin, driven by its lower water production, cost efficiency, and higher oil potential. Traditionally overshadowed by the Spraberry and Wolfcamp formations, the Barnett’s gas-prone nature, coupled with its ability to yield higher oil cuts in certain areas, has sparked growing interest among operators, including major players like Pioneer Natural Resources, Elevation Resources, and Continental Resources. As drilling activity intensifies, advanced techniques such as 3D seismic surveys have played a pivotal role in unlocking the deeper, more complex formations of the Barnett, enabling more precise targeting and improved well performance. With operators seeing promising returns, the Barnett Shale is quickly becoming a key player in the Midland Basin’s evolving landscape, offering substantial economic potential for those willing to explore its deeper zones. For more details on the development of this emerging formation target, read the following TGS Spotlight article.
Eagle Ford Basin
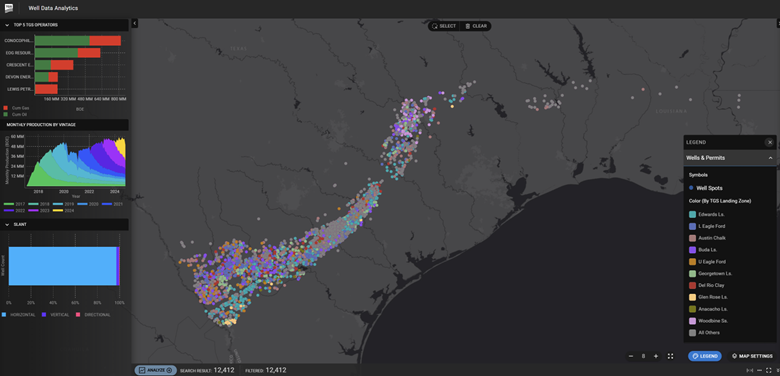
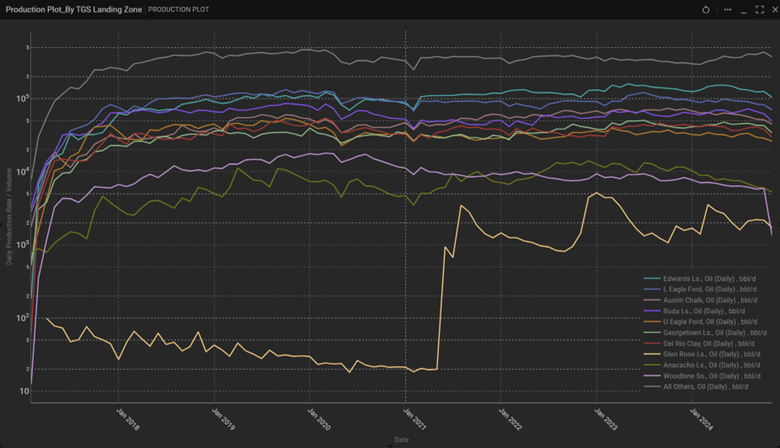
The map reveals a dense concentration of wells in the Eagle Ford formation, where horizontal drilling remains the dominant technique. Operators continue to prioritize this region due to its well-established productivity, with multiple landing zones targeted for optimization. The data suggests strategic development across formations such as Edwards, Austin Chalk, and Buda, though Eagle Ford remains the primary focus for maximizing output (Image 6).
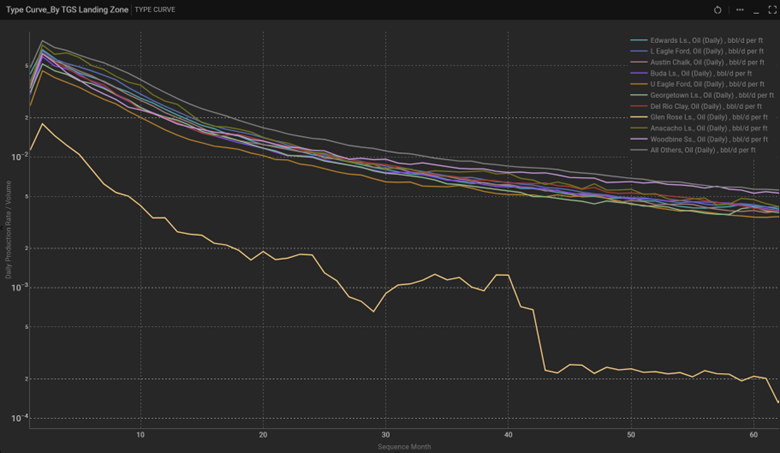
Production data highlights the combined output of Lower and Upper Eagle Ford leading regional volumes at approximately 126,000 barrels per day. Secondary formations such as Buda and Austin Chalk contribute 62,000 bbl/day and 51,000 bbl/day, respectively, while Georgetown Limestone adds around 43,000 bbl/day.
While recent data indicates notable volumes from the Edwards Limestone, estimated at roughly 125,000 bbl/day, there is some uncertainty regarding the true productivity of this formation. Variability in well performance suggests potential discrepancies tied to landing zone interpretations rather than consistent reservoir characteristics. As a result, operators appear to be approaching the Edwards Limestone with caution, maintaining their primary development focus on the proven productivity of the Eagle Ford.
These trends may also reflect ongoing advancements in well completions and reservoir management strategies, further optimizing efficiency across formations (Image 7).
1.4 Type Curve Analysis
We continue to analyze the evolving production landscape by utilizing type curve analysis, which provides valuable insights into the undeveloped resource potential. This helps estimate future output from locations that have yet to be drilled and completed.
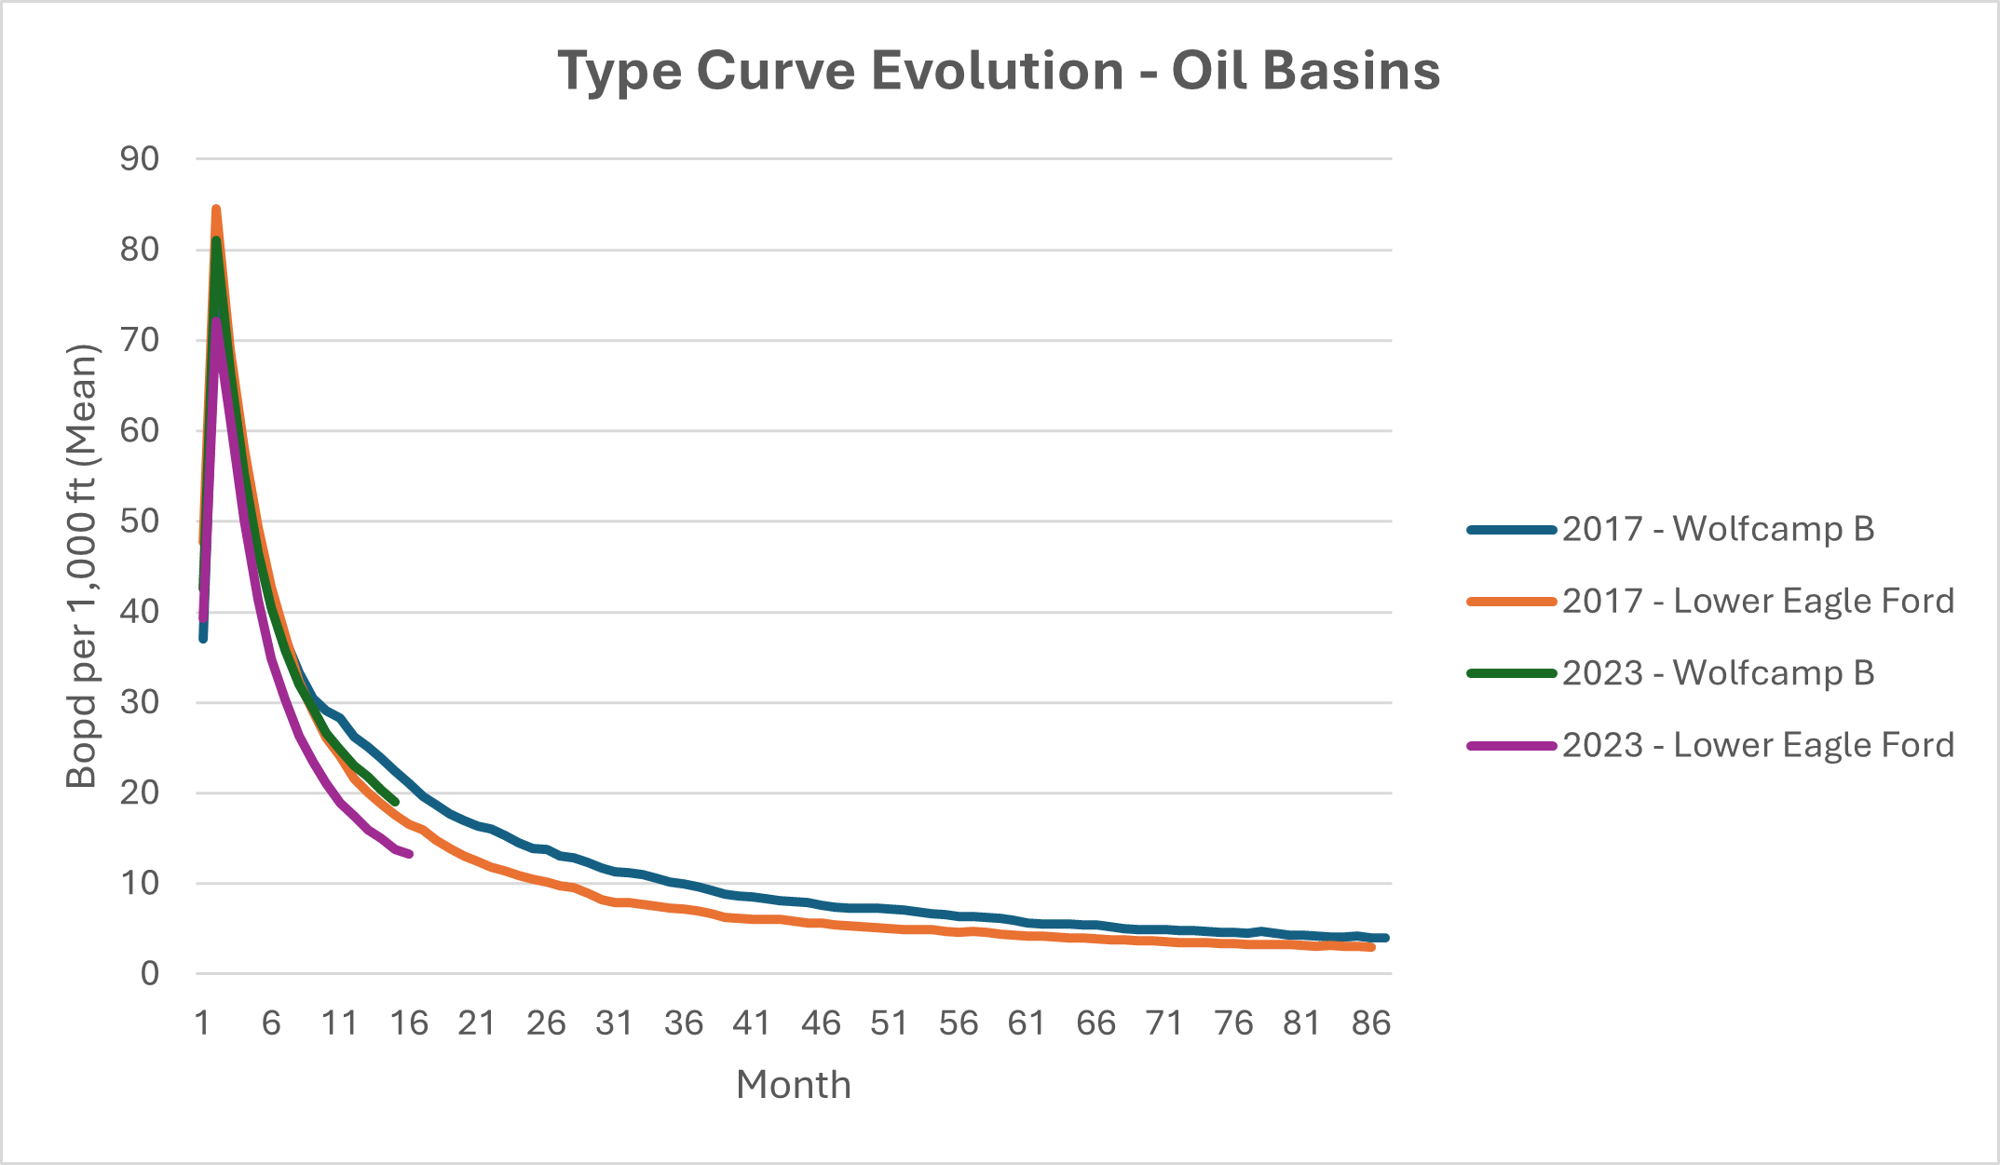
By applying this methodology, the study focused on two major oil-producing formations: Wolfcamp B and Lower Eagle Ford. Recent data analysis from these formations shows a clear decline in well productivity over time. Initially, there is a surge in production, followed by a steep drop before stabilizing at lower rates, which is typical production behavior for an unconventional. Despite variations in peak output, both formations ultimately reach similar stabilized production levels, emphasizing the critical role of early-time production behavior in shaping long-term well performance and resource economic potential.
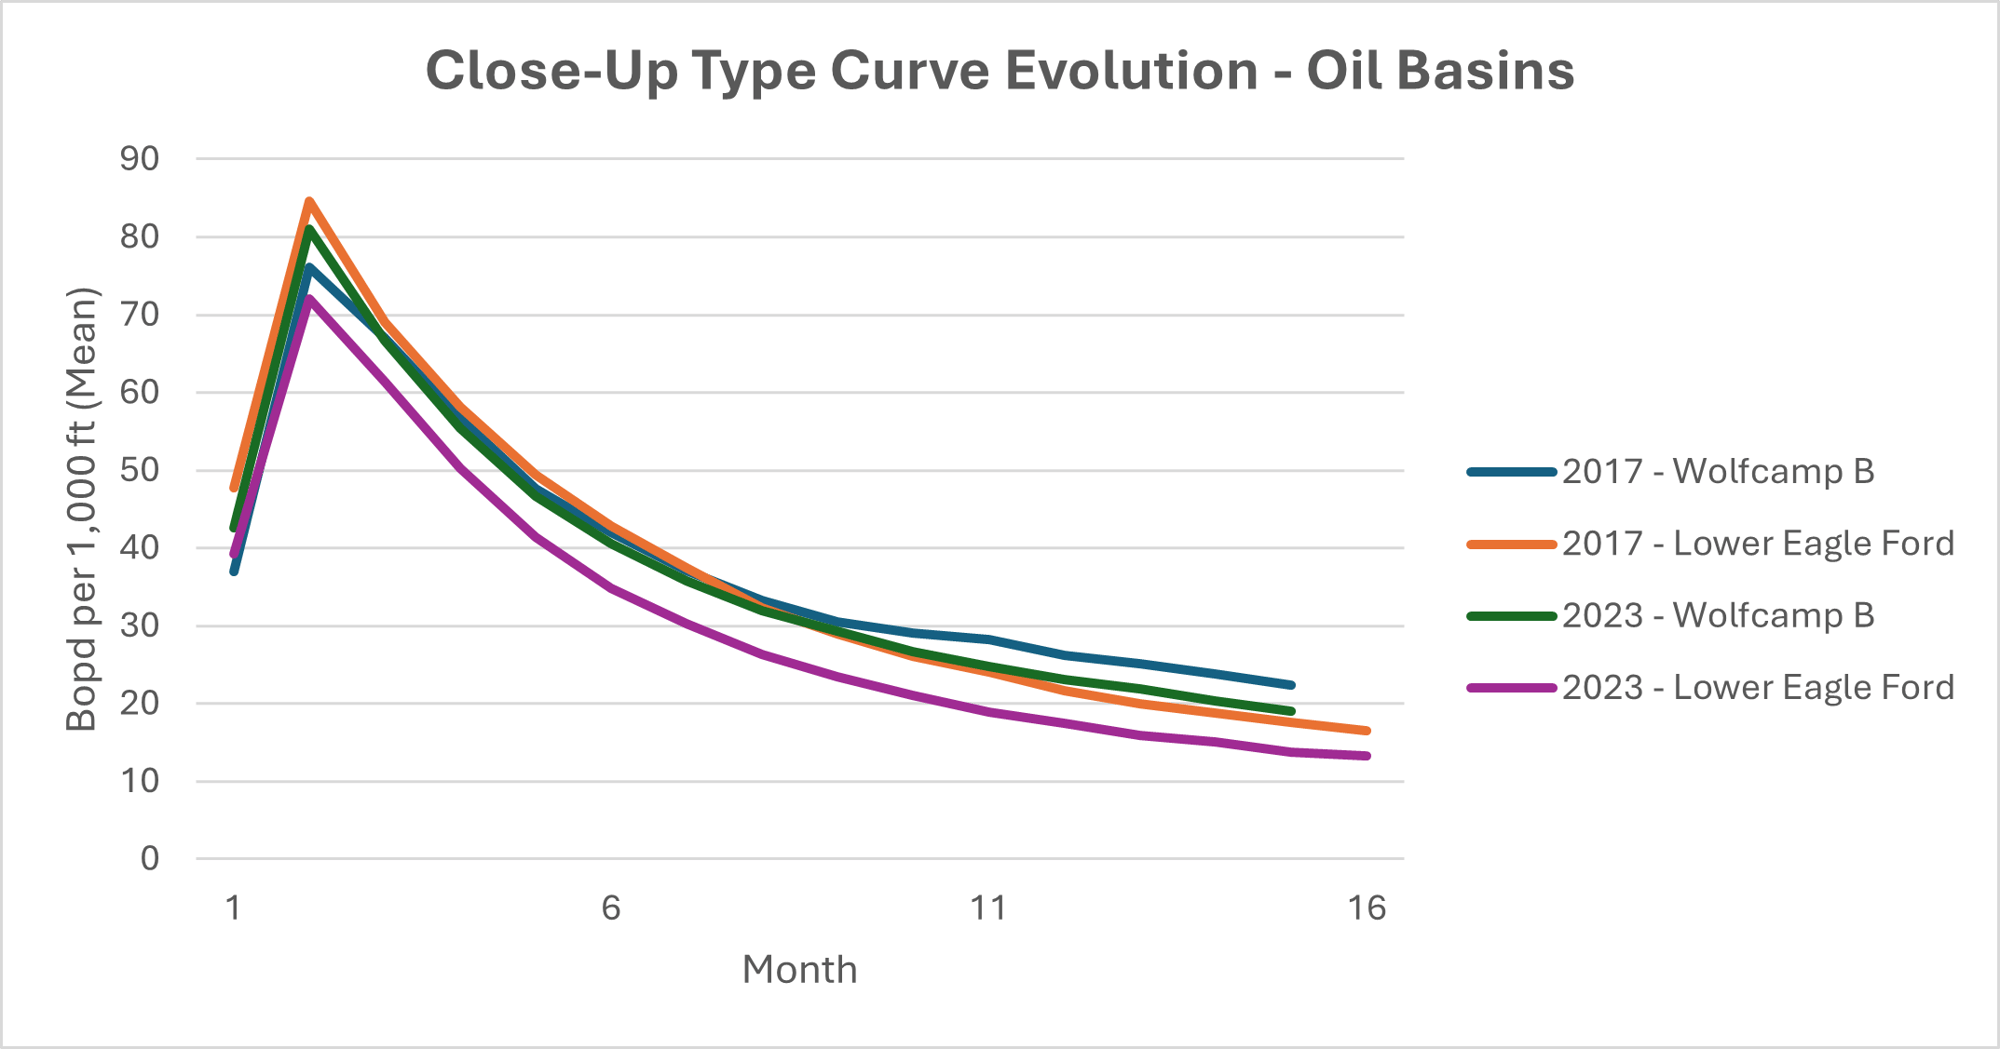
Wells drilled in 2023 show lower production rates per 1,000 ft compared to 2017, signaling potential changes in reservoir conditions, depletion, or evolving completion techniques. Notably, Lower Eagle Ford wells in 2017 peaked above 80 Bopd per 1,000 ft, making them the most productive in early months, though they also faced the most significant drop-off. In contrast, Wolfcamp B wells in 2017 displayed a more gradual decline, preserving their performance for a longer duration. By 2023, both formations experienced reduced peak rates, with Lower Eagle Ford seeing the sharpest drop in early-time production (Figure 9).
Despite these differences in initial output, long-term performance trends reveal a convergence in production rates across all formations after the first 12-18 months. The Wolfcamp B formation, both in 2017 and 2023, demonstrates a more sustained production profile, ultimately outperforming the Lower Eagle Ford, which stabilizes at a lower level. This suggests that while early-time production behavior varies, long-term recovery rates may be more predictable across different development periods. The overall decline in well performance underscores the need for advancements in drilling and completion strategies to counteract diminishing returns and optimize reservoir recovery (Figure 10).
1.5 Economic Analysis
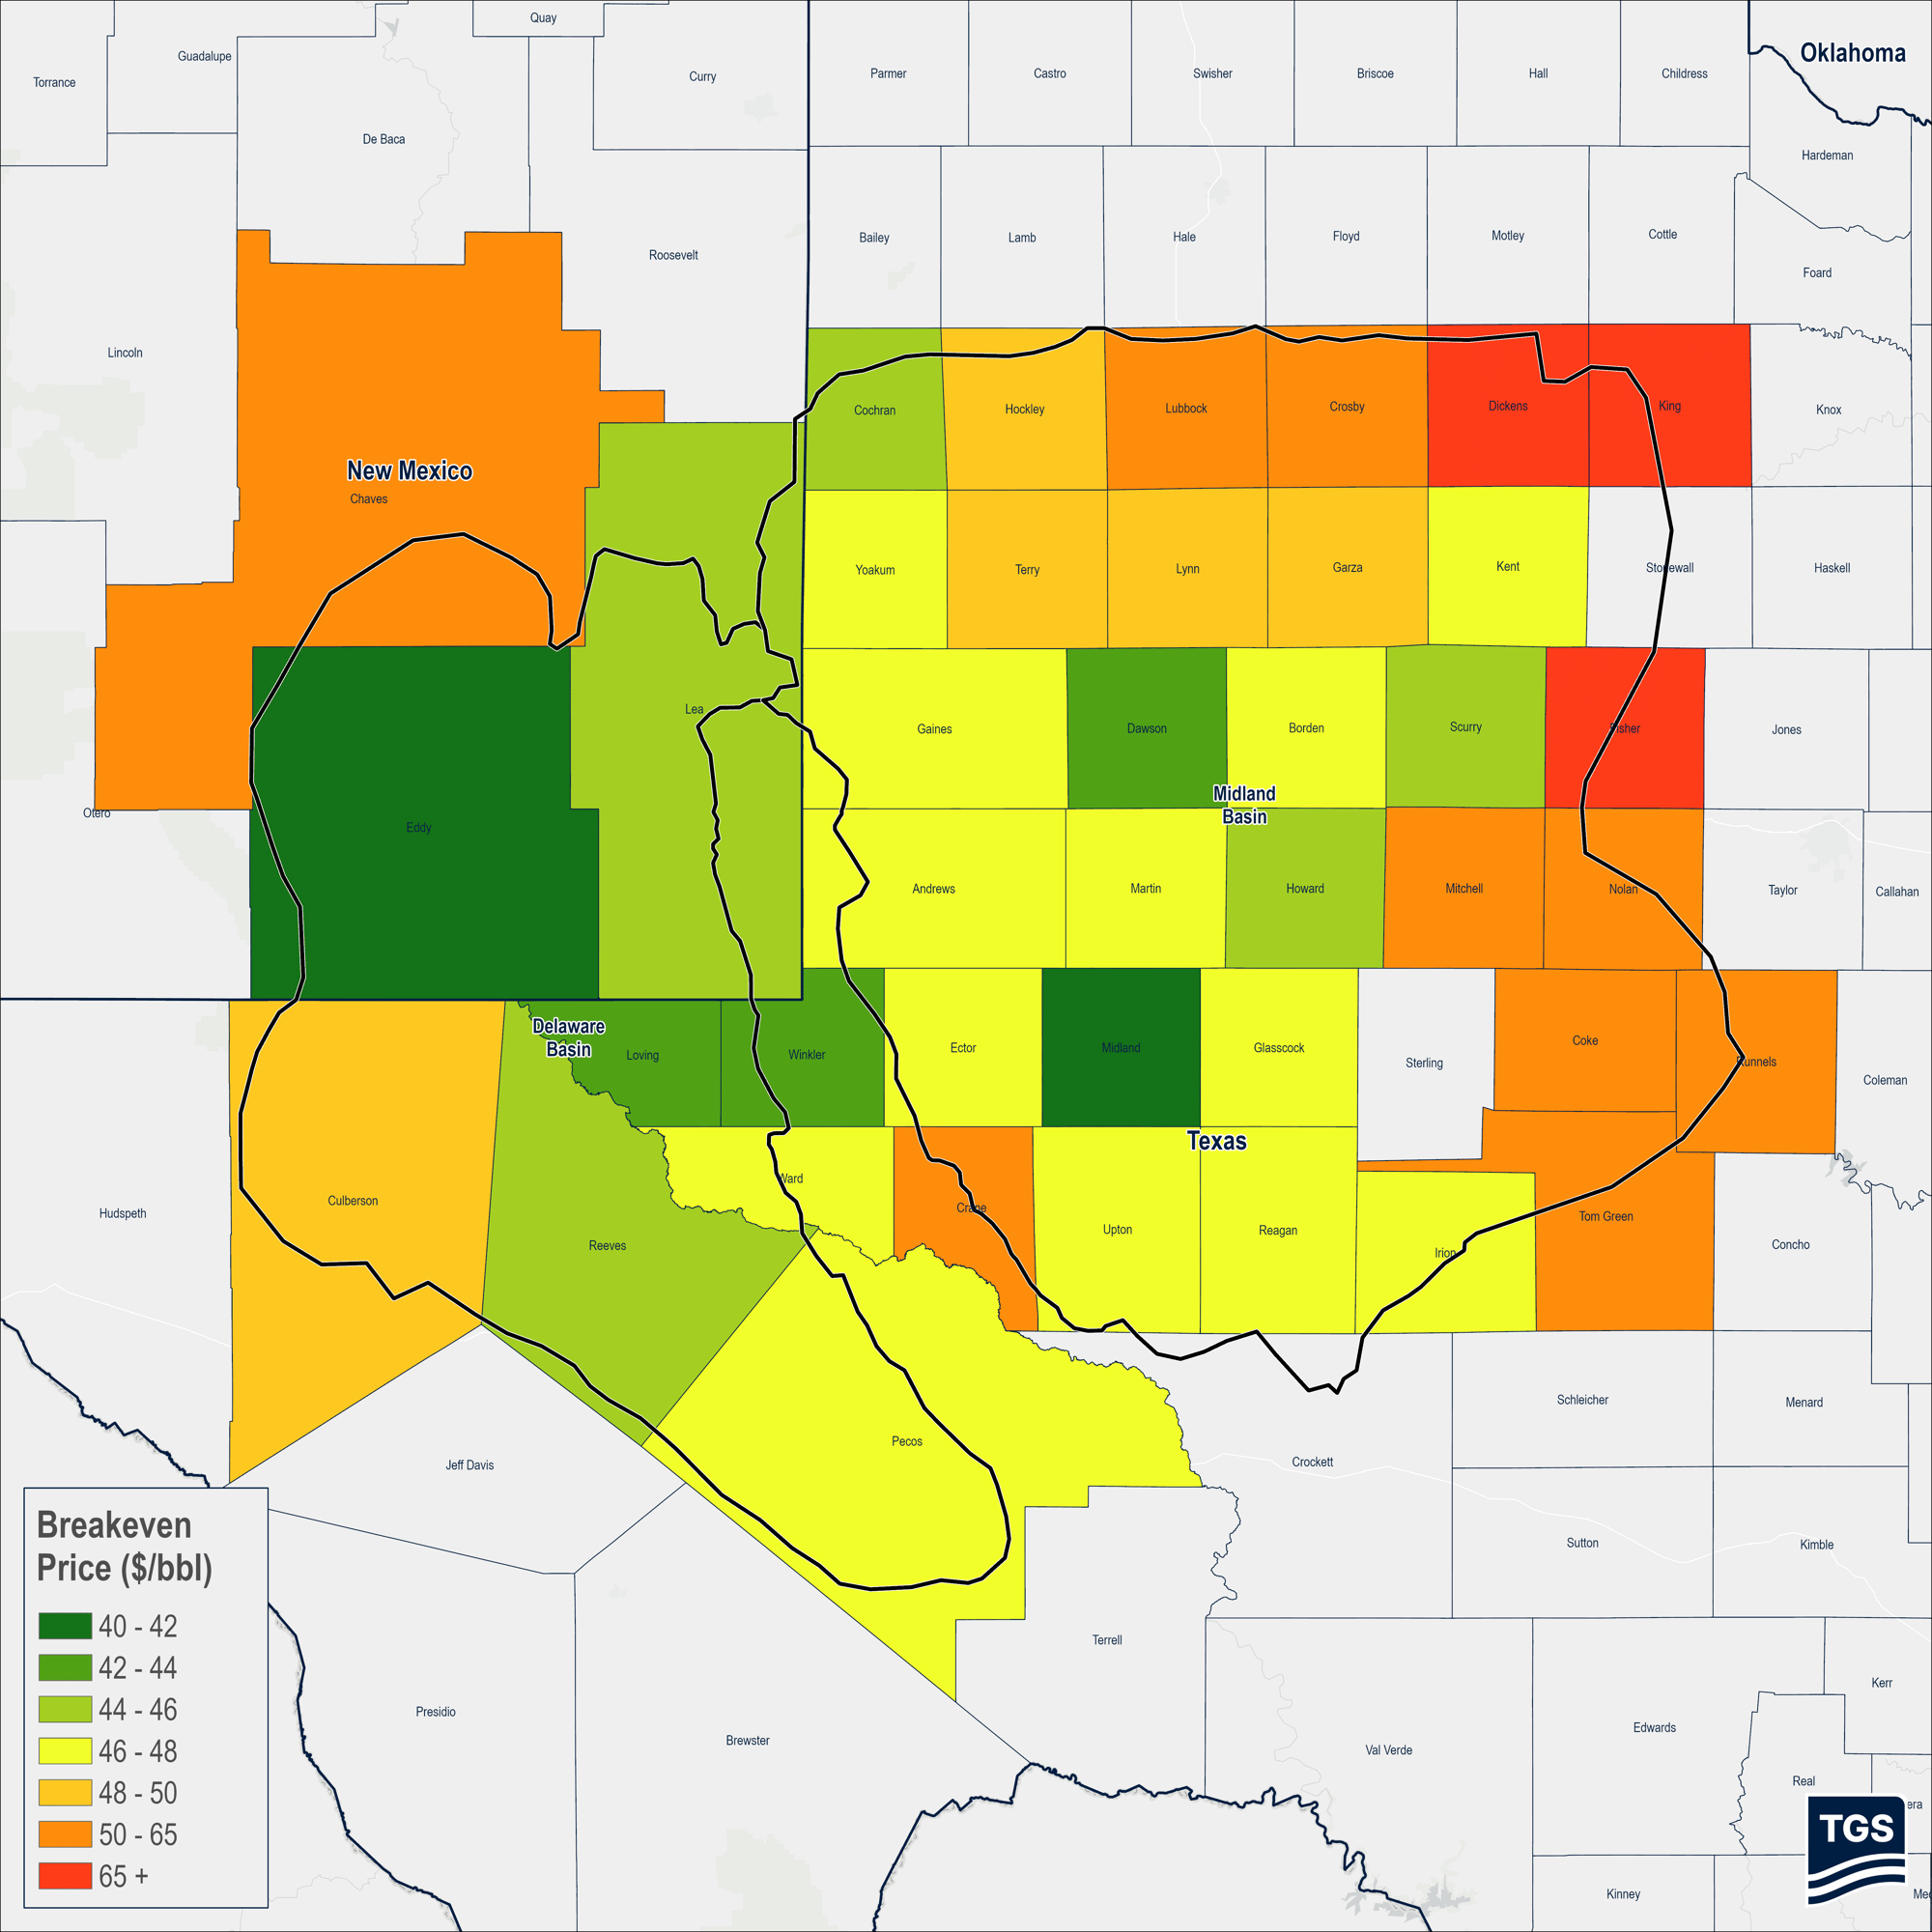
Leveraging breakeven outputs for wells put on production after 2017, economic maps can be created (Figures 11&12). A quick look at both maps reveals that the Permian Basin generally has lower breakeven prices in its most productive core areas, dipping as low as the low-$40 range per barrel. By contrast, the Eagle Ford’s most cost-effective zones cluster in the mid-$40s to $50 range, with fewer counties breaking below $42. This difference suggests that the Permian’s sweet spots may offer a marginally lower cost environment, giving operators there a slight competitive edge on the cheapest drilling opportunities.
On the higher end of the scale, the Permian’s outlying counties mostly top out around the mid-$50s to mid-$60s range, whereas parts of the Eagle Ford can exceed $70 per barrel. These more expensive Eagle Ford areas—often located in the formation’s northeastern segment—are significantly more vulnerable to market downturns. Consequently, while both plays include a mix of low and high breakeven zones, the Eagle Ford shows a sharper contrast between its cheapest and most expensive areas.
Overall, both regions offer attractive drilling opportunities but exhibit notable differences in cost structure. The Permian, with
a broader swath of sub-$50 breakeven zones, remains highly competitive for operators focusing on efficiency and profit margins. Meanwhile, the Eagle Ford, though still boasting pockets of relatively low-cost acreage, has more pockets above $60
or even $70, requiring careful project selection and potentially more advanced drilling and completion techniques to remain economically viable and unlock the potential of these more expensive undeveloped locations.
1.6 Asset Economics and Cash Flow Analysis
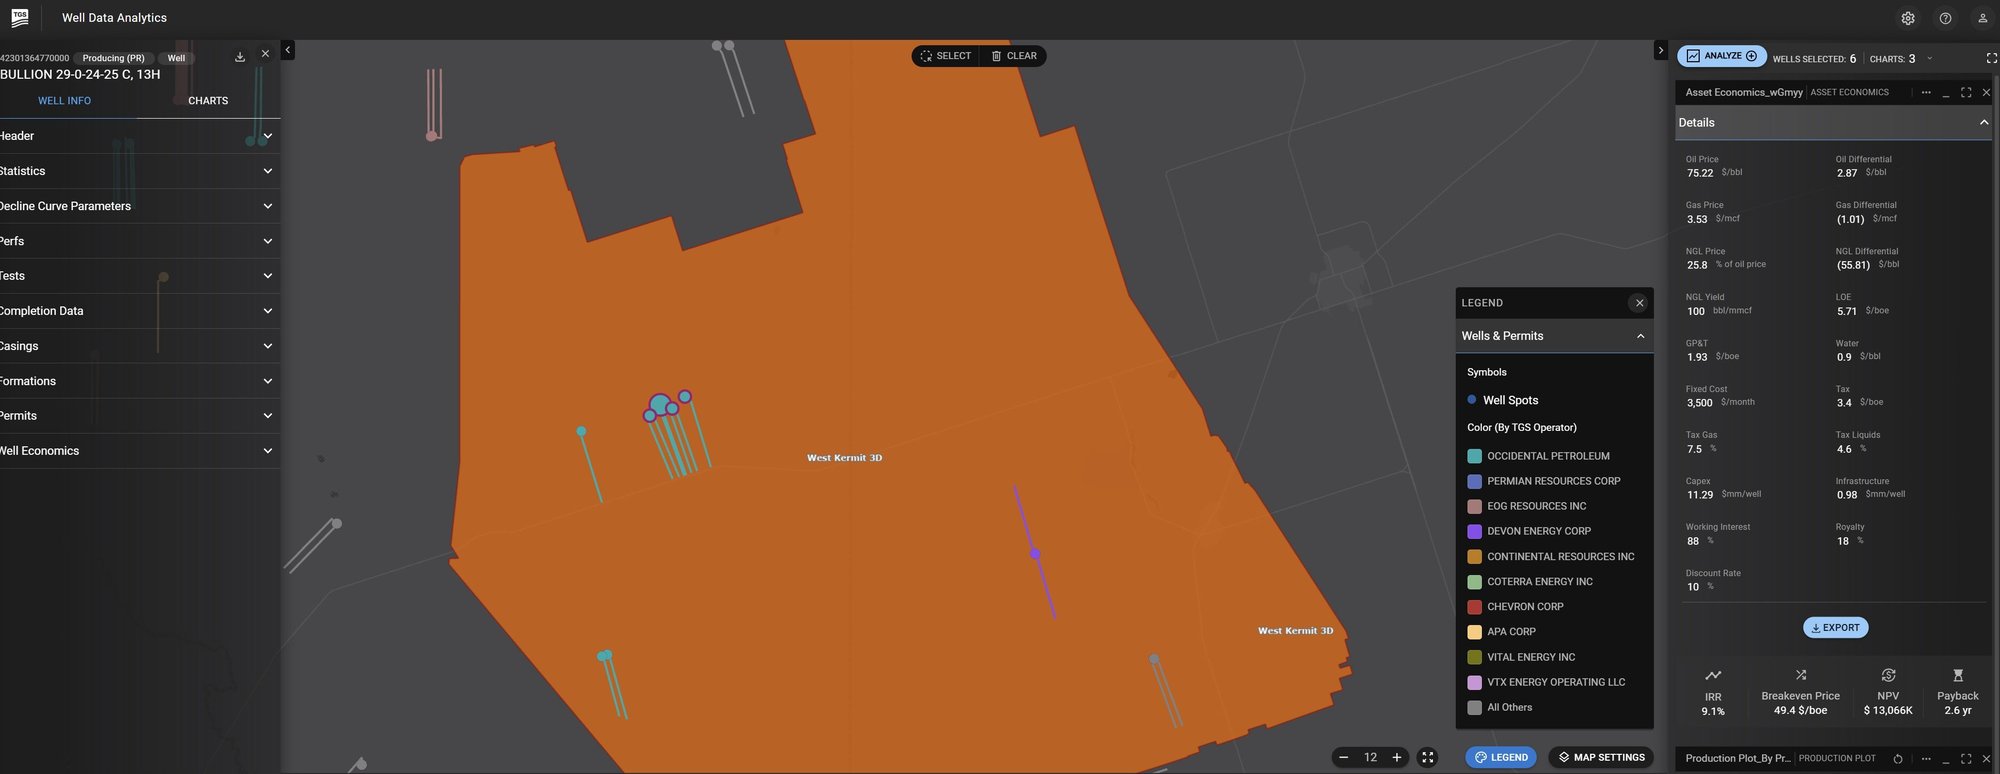
One may wonder: everything seems logical up to this point, but how can WDA help my company assess asset economics and cash flow analysis once we have narrowed down the opportunity to a set of wells? We will use the West Kermit 3D in the Delaware Basin as an example.
In 2017 and 2018, TGS acquired and processed the West Lindsey and West Kermit 3D seismic surveys in the heart of the Delaware Basin, providing operators with critical insights for developing Wolfcamp and Bone Spring stacked play targets. By the end of 2023, TGS further advanced industry knowledge by publishing a Well Intel article on seismic-guided shale development. Now, with the latest enhancement to the well economics product – allowing users to aggregate wells for more comprehensive asset economic analysis – we can evaluate the financial performance of OXY’s Bullion Pad in the region with greater precision and depth.
The graphs below (Images 9, 10 on this page & 11 on the following page) present a cash flow projection for an aggregation of wells in the Bullion Pad within the Delaware Basin, specifically those from the 2023 vintage. The initial phase exhibits substantial cash flow volatility, characterized by high revenue spikes driven by early production peaks, counterbalanced by significant upfront expenses associated with drilling and completion costs. Over time, both revenue and expenses taper off, reflecting natural production decline and stabilized operating costs, leading to a more predictable cash flow equilibrium. Despite the initial capital intensity, the wells achieve overall positive cash flow, reinforcing their economic viability. The model’s key economic outputs indicate an internal rate of return (IRR) of 9.1%, a breakeven price of approximately $50 per barrel, a net present value (NPV) of around $13 million, and a payback period of 2.6 years, highlighting their long-term financial sustainability.

1.7 New Trends to Watch For
Permian Basin
The Midland Basin is entering 2025 with a notably lower inventory of drilled but uncompleted (DUC) wells based on EIA data, a shift that could reshape capital allocation and production strategies for exploration and production (E&P) companies. DUCs have declined across nearly every shale play, in some cases by the hundreds, as operators prioritized completions over new drilling in response to market conditions. This trend suggests that producers have been leveraging their existing well inventory to sustain output without ramping up rig activity. However, as DUCs dwindle, companies may face mounting pressure to increase drilling, which could drive up capital expenditures and impact overall efficiency.
This rapid depletion of the DUC backlog is also reshaping the competitive landscape in the Midland Basin. Operators that maintained a more balanced approach – preserving a steady stream of both drilling and completions – could find themselves in a more favorable position, able to sustain production without abrupt increases in capital spending. On the other hand, those who aggressively completed wells in the past year may now have to accelerate drilling programs, potentially at higher service costs, to avoid production declines. If rig counts do not rise in tandem with the drop in DUCs, the basin could experience a temporary production plateau, influencing both regional output forecasts and broader market dynamics. As the industry moves forward, E&Ps will need to carefully manage capital efficiency, drilling schedules, and service costs to maintain production momentum in a more constrained operational environment.

Eagle Ford
In the Eagle Ford shale play, a significant new trend is the increasing focus on “refracturing” existing wells. Major operators are identifying large numbers of potential refrac candidates, aiming to significantly boost oil recovery from mature wells
by re-stimulating the reservoir through advanced fracturing techniques. This trend is often accompanied by acquisitions
of smaller companies with established Eagle Ford positions to access these refrac opportunities. Refracturing can potentially increase the original estimated ultimate recovery (EUR) of a well by a substantial percentage, allowing operators to extract more oil from existing wells. Compared to drilling new wells, refracs can be a cost-effective way to extend production life in mature areas. For example, the use of advanced techniques like mechanical isolation and fiber optic monitoring to optimize refrac operations and target specific areas within the reservoir can make this approach both efficient and economically viable.
Conclusion
In summary, Well Data Analytics data and intelligence are instrumental in navigating production trends, challenges, and opportunities. By leveraging Well Economic Data, companies can streamline workflows, optimize capital allocation, and effectively manage the complexities of the evolving energy landscape. Encouraging stakeholders to adopt WDA workflows will enhance operational and planning decision-making processes, equipping them with the tools needed for sustained success and competitive advantage.


