Using TGS Well Data Analytics to investigate completion and productivity trends.
Multiple articles and analyses in recent weeks have discussed declining trends in US Shale output, rig rates, and overall productivity. While some articles have highlighted changes in completion design or drawdown of DUC inventories to offset declining historic production, others point to a more pessimistic view of the remaining inventory as the primary driver for productivity losses. But are the key performance indicators really trending in the wrong direction?
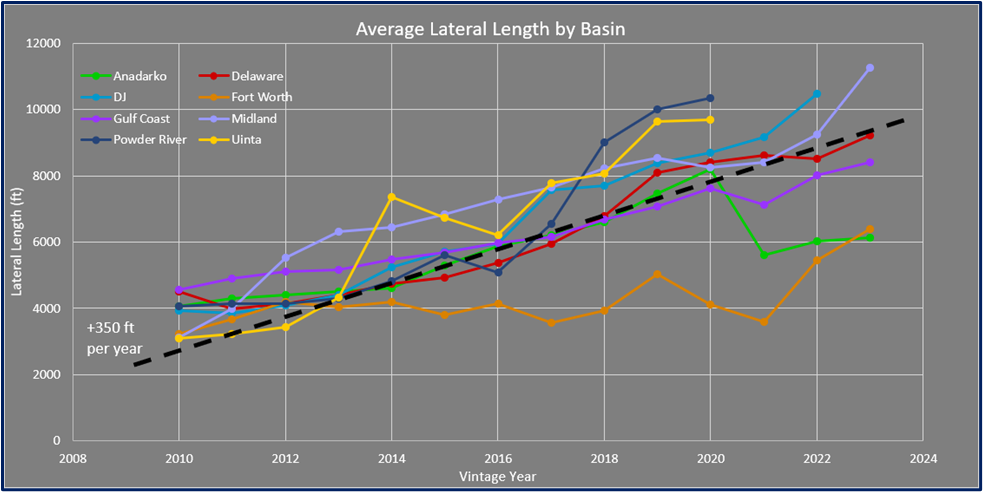
Using TGS Well Data Analytics we can identify a clear positive trend in lateral length. While this varies from basin to basin, overall US onshore unconventional wells have continually increased in lateral length by around 350 feet per year. Although some of the articles listed above have tied this trend to declining rig counts, this is likely just as much a result of optimizing for the highest amount of reservoir contact per drilling and completion cost. 
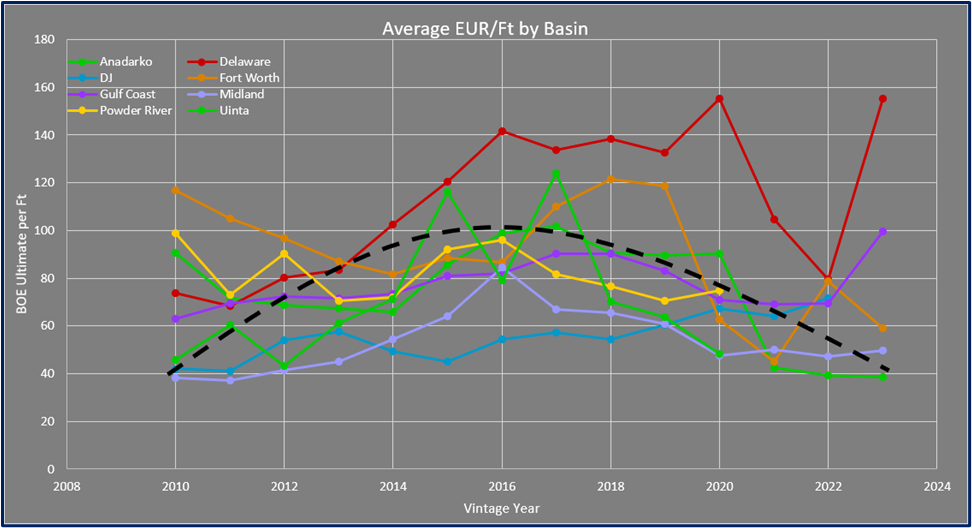
Now that we know reservoir contact is continuing to trend upwards, how does that affect well productivity levels? According to the same TGS Well Data Analytics dataset, productivity levels per foot increased across most basins, peaking around 2016. But in recent years shale productivity has returned to early 2010 levels. This is a trend that was referenced in some of the articles listed above and was primarily attributed to remaining shale inventories having lower-quality reservoirs.
However, even in lower tier acreage, there is room for optimization of completion design and landing zone targeting. In an upcoming TGS Well Intel article we will explore case studies and real-world results of how TGS data can help improve well productivity by targeting better reservoirs with increased accuracy.
You can sign up here to be notified when the follow-up Well Intel article is released.
For more information on Well Data Analytics or to schedule a demo, contact us at WDPSales@tgs.com.


